- Advanced Excel Functions Tutorial
- Advanced Excel Functions - Home
- Compatibility Functions
- Advanced Excel Functions - Cube
- Database Functions
- Date & Time Functions
- Engineering Functions
- Financial Functions
- Information Functions
- Advanced Excel Functions - Logical
- Lookup & Reference Functions
- Math & Trignometric Functions
- Statistical Functions
- Useful Resources
- Quick Guide
- Useful Resources
- Discussion
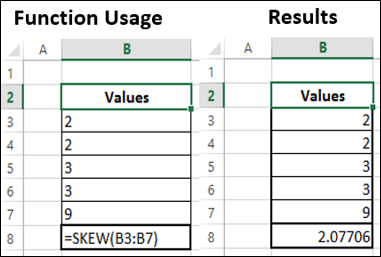
Advanced Excel Statistical - SKEW Function
Description
The SKEW function returns the skewness of a distribution.
Skewness characterizes the degree of asymmetry of a distribution around its mean.
Positive skewness indicates a distribution with an asymmetric tail extending toward more positive values.
Negative skewness indicates a distribution with an asymmetric tail extending toward more negative values.
Syntax
SKEW (number1, [number2] ...)
Arguments
| Argument | Description | Required/ Optional |
|---|---|---|
| Number1 | 1 to 255 arguments for which you want to calculate skewness. You can also use a single array or a reference to an array instead of arguments separated by commas. |
Required |
| number2, ... | optional |
Notes
The equation for skewness is defined as −
$$\frac{n}{\left ( n-1 \right )\left ( n-2 \right )}\sum \left ( \frac{x_i-\bar{x}}{s} \right )^3$$
Arguments can either be numbers or names, arrays, or references that contain numbers.
Logical values and text representations of numbers that you type directly into the list of arguments are counted.
If an array or reference argument contains text, logical values, or empty cells, those values are ignored. However, cells with the value zero are included.
Arguments that are error values or text that cannot be translated into numbers cause errors.
If there are fewer than three data points, or the sample standard deviation is zero, SKEW returns the #DIV/0! error value.
If any of the number arguments that are supplied directly to the function are not recognized as numeric values, Skew returns the #VALUE! error value.
Applicability
Excel 2007, Excel 2010, Excel 2013, Excel 2016
Example