- Advanced Excel Functions Tutorial
- Advanced Excel Functions - Home
- Compatibility Functions
- Advanced Excel Functions - Cube
- Database Functions
- Date & Time Functions
- Engineering Functions
- Financial Functions
- Information Functions
- Advanced Excel Functions - Logical
- Lookup & Reference Functions
- Math & Trignometric Functions
- Statistical Functions
- Useful Resources
- Quick Guide
- Useful Resources
- Discussion
Statistical - PEARSON Function
Description
The PEARSON function returns the Pearson product moment correlation coefficient, r, a dimensionless index that ranges from -1.0 to 1.0 inclusive and reflects the extent of a linear relationship between two data sets.
Syntax
PEARSON (array1, array2)
Arguments
| Argument | Description | Required/ Optional |
|---|---|---|
| Array1 | A set of independent values. | Required |
| Array2 | A set of dependent values. | Required |
Notes
The formula for the Pearson product moment correlation coefficient, r, is −
$$r=\frac{\sum \left ( x-\bar{x} \right )\left ( y-\bar{y} \right )}{\sqrt{\sum \left (x-\bar{x} \right )^2 \sum \left ( y-\bar{y} \right )^2}}$$
Where x and y are the sample means AVERAGE (array1) and AVERAGE (array2).
The arguments must be either numbers or names, array constants, or references that contain numbers.
If an array or reference argument contains text, logical values, or empty cells, those values are ignored. However, cells with the value zero are included.
If array1 and array2 have a different number of data points, PEARSON returns the #N/A error value.
If array1 or array2 is empty or if the standard deviation of their values is equal to zero, PEARSON returns the #DIV/0! error value.
Applicability
Excel 2007, Excel 2010, Excel 2013, Excel 2016
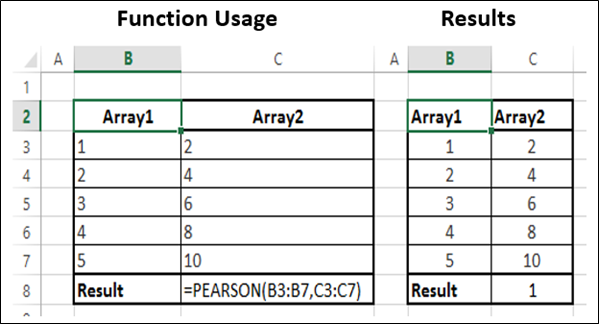
Example