- XGBoost - Home
- XGBoost - Overview
- XGBoost - Architecture
- XGBoost - Installation
- XGBoost - Hyper-parameters
- XGBoost - Tuning with Hyper-parameters
- XGBoost - Using DMatrix
- XGBoost - Classification
- XGBoost - Regressor
- XGBoost - Regularization
- XGBoost - Learning to Rank
- XGBoost - Over-fitting Control
- XGBoost - Quantile Regression
- XGBoost - Bootstrapping Approach
- XGBoost - Python Implementation
- XGBoost vs Other Boosting Algorithms
- XGBoost Useful Resources
- XGBoost - Quick Guide
- XGBoost - Useful Resources
- XGBoost - Discussion
XGBoost - Python Implementation
In this chapter we will use the XGBoost Python module to train an XGBoost model on Titanic data. Our main goal to generate this model is to predict whether a passenger survived by considering variables like age, gender and class. Also we will modify hyper-parameters of our model.
Prerequisites
The following conditions must be met before you can use Python to build an XGBoost model −
Python Environment: It requires Python version 3.6 or later version. You can use a libraries like PyCharm, Visual Studio Code or Jupyter Notebook to write and run your Python code.
Libraries: The Python libraries required for data manipulation, visualization, and machine learning should be installed. The libraries we will be using in our model are scikit-learn, xgboost, matplotlib, pandas, numpy and seaborn.
Dataset: A valid dataset with features and a dependent variable for binary or multi-class classification. The dataset needs to be in a format, like CSV that pandas can load quickly.
Possessing the necessary tools, libraries, dataset, and basic knowledge will help you to use Python for building an XGBoost model.
XGBoost Implementation
Here are the steps you need to follow −
Step 1: Install Needed Libraries
We need some libraries for this implementation so install them with the help of the following commands if you have not already −
# Install necessary libraries
pip install matplotlib
pip install numpy
pip install pandas
pip install scikit-learn
pip install seaborn
pip install xgboost
Step 2: Import Required Libraries
Now you have to import the libraries −
# Here are the imports
import matplotlib.pyplot as plt
import numpy as np
import pandas as pd
import seaborn as sns
import xgboost as xgb
from sklearn.metrics import accuracy_score, confusion_matrix, ConfusionMatrixDisplay
from sklearn.model_selection import GridSearchCV, train_test_split
Step 3: Load the Titanic Dataset
This course will make use of the Titanic dataset which can be downloaded from Kaggle and other sites. So download titanic.csv to get the Titanic dataset. You need to upload a CSV file to your Jupyter Notebook. At this point read the data into a pandas DataFrame −
# Load the dataset
titanic_df = pd.read_csv('/Python/Datasets/titanic.csv')

# Display the first few rows of the dataset
print(titanic_df.head())
Output
This will produce the following result −
   PassengerId  Survived  Pclass  \
0            1         0       3
1            2         1       1
2            3         1       3
3            4         1       1
4            5         0       3

                                                Name     Gender   Age  SibSp  \
0                            Braund, Mr. Owen Harris    male  22.0      1
1  Cumings, Mrs. John Bradley Florence Briggs Th...  female  38.0      1
2                             Heikkinen, Miss. Laina  female  26.0      0
3       Futrelle, Mrs. Jacques Heath (Lily May Peel)  female  35.0      1
4                           Allen, Mr. William Henry    male  35.0      0

   Parch            Ticket     Fare Cabin Embarked
0      0         A/5 21171   7.2500   NaN        S
1      0          PC 17599  71.2833   C85        C
2      0  STON/O2. 3101282   7.9250   NaN        S
3      0            113803  53.1000  C123        S
4      0            373450   8.0500   NaN        S
Step 4: Data Pre-processing
Before we train the model we need the data should be preprocessed. This step includes handling missing data, encoding categorical variables and selecting features. Look for any values that are missing −
# Check for missing values
print(titanic_df.isnull().sum())
Output
This will generate the following result −
PassengerId      0
Survived         0
Pclass           0
Name             0
Gender              0
Age            177
SibSp            0
Parch            0
Ticket           0
Fare             0
Cabin          687
Embarked         2
dtype: int64
Fill in the blanks or remove them −
# Drop rows with missing values
titanic_df = titanic_df.dropna()
Now we will select necessary features and encode categorical variables:
# Select features and target variable
X = titanic_df[['Pclass', 'Gender', 'Age', 'SibSp', 'Parch', 'Fare']]
y = titanic_df['Survived']

# Encode categorical variable 'Gender'
X.loc[:, 'Gender'] = X['Gender'].map({'male': 0, 'female': 1})
Step 5: Train and Evaluate the Model
After separating the data into training and testing sets now we will train the model and evaluate its effectiveness. Here split the data as follows −
# Split data into training and testing sets
X_train, X_test, y_train, y_test = train_test_split(X, y, test_size=0.3, random_state=0)
Next we need to convert the data to DMatrix format for the XGBoost model −
# Convert 'Gender' column to numeric in both training and test sets
X_train['Gender'] = X_train['Gender'].map({'male': 0, 'female': 1})
X_test['Gender'] = X_test['Gender'].map({'male': 0, 'female': 1})

# Ensure there are no missing values and data types are numeric
X_train = X_train.astype(float)
X_test = X_test.astype(float)

# Now convert to DMatrix format
dmatrix_train = xgb.DMatrix(data=X_train, label=y_train)
dmatrix_test = xgb.DMatrix(data=X_test, label=y_test)
Then we will train the model −
# Set learning objective
learning_objective = {'objective': 'binary:logistic'}

# Train the model
model = xgb.train(params=learning_objective, dtrain=dmatrix_train)
After that we have to evaluate the model −
# Make predictions
test_predictions = model.predict(dmatrix_test)
round_test_predictions = [round(p) for p in test_predictions]

# Calculate accuracy
accuracy = accuracy_score(y_test, round_test_predictions)
print(f'Accuracy: {accuracy:.2f}')
Output
This will create the below outcome −
Accuracy: 0.80
Step 6: Hyperparameter Tuning
We will now implement hyper-parameter tuning with GridSearchCV to find the ideal parameters for our XGBoost model. So set up the parameters grid −
# Define the parameter grid
params_grid = {
    'learning_rate': [0.01, 0.05],
    'gamma': [0, 0.01],
    'max_depth': [6, 7],
    'min_child_weight': [1, 2, 3],
    'subsample': [0.6, 0.7],
    'n_estimators': [400, 600, 800],
    'colsample_bytree': [0.7, 0.8],
}
Define and set up the XGBoost classifier and GridSearchCV −
# Define the XGBoost classifier
classifier = xgb.XGBClassifier()

# Set up GridSearchCV
grid_classifier = GridSearchCV(classifier, params_grid, scoring='accuracy', cv=5)
grid_classifier.fit(X_train, y_train)
After determining the most suitable parameters we will evaluate the model:
# Get best parameters
best_parameters = grid_classifier.best_params_
print("Best parameters:", best_parameters)

# Make predictions with the best model
grid_test_preds = grid_classifier.predict(X_test)

# Calculate accuracy
grid_test_accuracy = accuracy_score(y_test, grid_test_preds)
print(f'GridSearchCV Accuracy: {grid_test_accuracy:.2f}')
Output
This will lead to the following outcome −
Best parameters: {'colsample_bytree': 0.7, 'gamma': 0, 'learning_rate': 0.01, 'max_depth': 7, 'min_child_weight': 1, 'n_estimators': 600, 'subsample': 0.7}
GridSearchCV Accuracy: 0.78
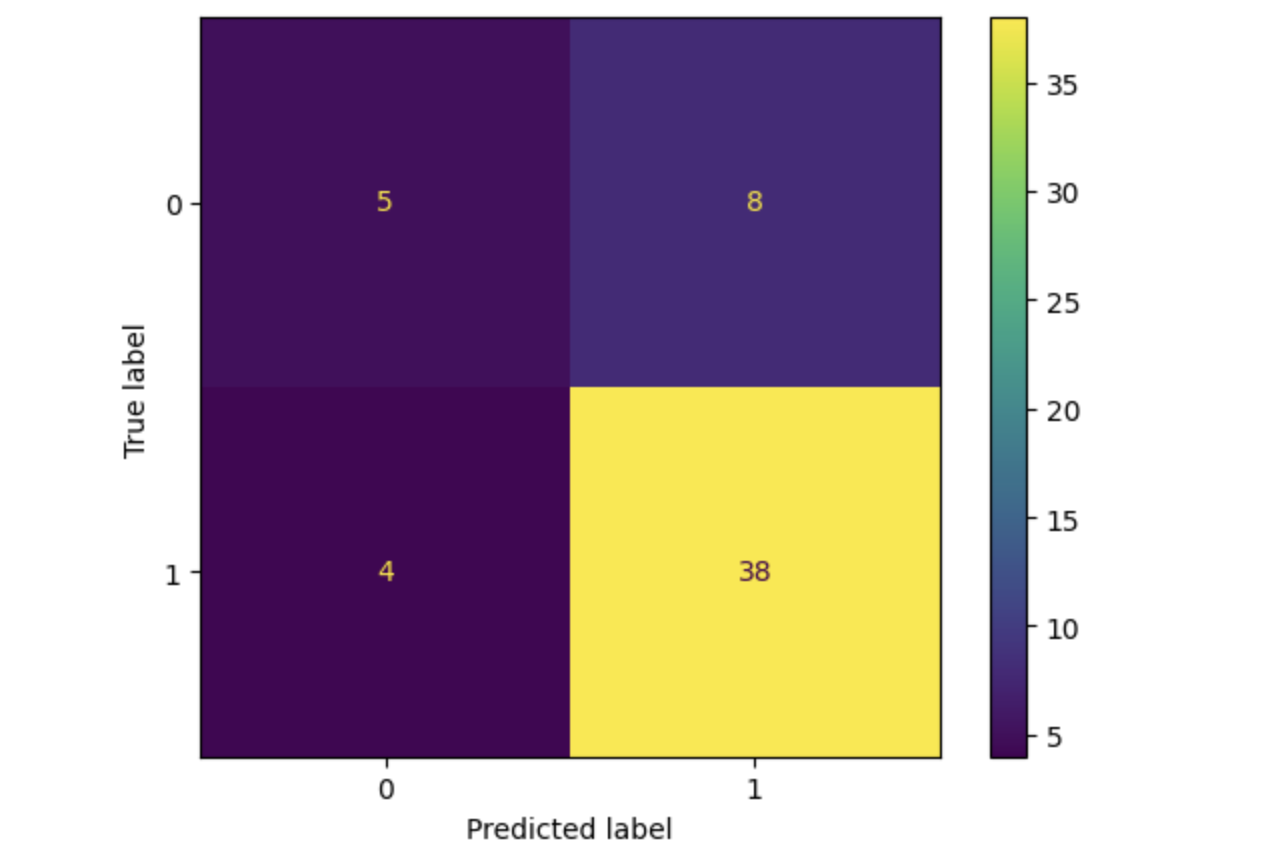
Here we are going to plot the confusion matrix.
# Plot confusion matrix
cm = confusion_matrix(y_test, grid_test_preds)
disp = ConfusionMatrixDisplay(confusion_matrix=cm, display_labels=grid_classifier.classes_)
disp.plot()
plt.show()
Output
This will lead to the following outcome −
Summary
We used the Titanic dataset to explain how to implement an XGBoost model in this chapter. So for improving the model's performance and you can look into alternative datasets.
