
Article Categories
- All Categories
-
 Data Structure
-
 Networking
-
 RDBMS
RDBMS
-
 Operating System
-
 Java
Java
-
 MS Excel
-
 iOS
iOS
-
 HTML
HTML
-
 CSS
CSS
-
 Android
-
 Python
-
 C Programming
-
 C++
C++
-
 C#
C#
-
 MongoDB
-
 MySQL
MySQL
-
 Javascript
-
 PHP
PHP
-
 Economics & Finance
Wireless Channel Noise – Definition, Models and Comparison
What is Wireless Channel Noise?
It is not possible to have any wireless communication system/link with absolutely zero noise level. Noise is additive and hence at the receiver, we have the signal that contains both the transmitted data and noise. The most commonly used noise model is the Additive White Gaussian Noise (AWGN). The noise follows Gaussian distribution with zero mean.
What are the effects of channel noise?
The channel noise could distort the original user data signal.
If the channel noise is too high, it will bring down the Signal-to-Noise Ratio (SNR) of the signal as a result of which the receiver might not be able to faithfully detect and decode the signal.
With a high channel noise, the signal might get buried under the noise.
Understanding Various Channel Noise Models in Detail
Noise models are characterized by their power spectral densities (PSD). PSD describes the power profile of the various frequency components present in the signal being analyzed. While there are different formulated noise models, the most commonly used noise model for radio wave, microwave and millimeter wave communications is the ‘white noise’ model.
Apart from white noise, we have flicker noise whose PSD is inversely proportional to signal frequency and Brownian noise who’s PSD is inversely proportional to the square of the signal frequency.
So, some of the well known noise models include
White noise
Flicker noise (pink noise or 1/f noise)
Brownian noise (also called the 1/f2 noise)
White Noise
White noise is the commonly used noise model for wireless communications. The response of PSD of white noise is flat which means that the PSD is independent of frequency.
The white noise is so named because of its similarity to white light which contains equal amounts or intensities of all frequencies of the visible spectrum
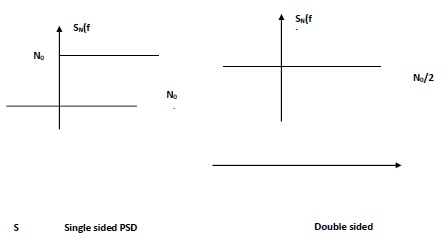
The single sided and double sided PSDs of white noise are shown in the above figure.
Flicker Noise
In the flicker noise model, the PSD is dependent on the frequency. The PSD decreases with increasing frequency and the relation is an inverse one. For this reason, the flicker noise is also called the ‘1/f’ noise.
Brownian Noise
The PSD decreases with increasing frequency and the rate of decrease is quick when compared to the Flicker noise model. This noise is also called the ‘1/f2 ’ noise.
Comparison of PSD
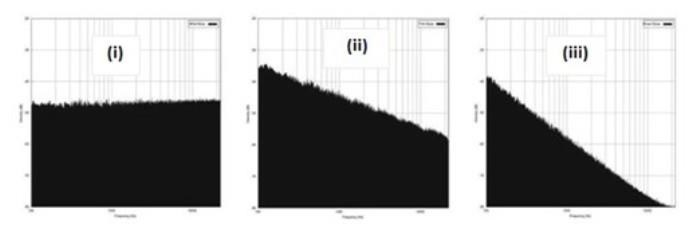
The figure presented above shows the power distribution as a function of frequency. The Y-axis displays the power level per Hertz and the X-axis displays the frequencies.
denotes PSD of white noise
denotes PSD of pink noise
denotes PSD of brown noise.
Noise and Interference
‘Noise’ and ‘Interference’ may generally relate to degradation/distortion of the transmitted signal but, in essence, there are some differences between the two. Consider a classroom where a teacher lectures the students. The students may not clearly listen to their teacher when they make noise among themselves. This can be associated with internal noise as present in components of amplifiers and oscillators.
The students may not be able to clearly listen to their teacher when there is an ongoing event outside, such as a parade. This can be associated with interference.
Noise is not internal this time. There is another possible scenario. Let a group of students talk with each other in language A and another group of students talk with each other in language B. As long as both the groups talk within permissible noise levels, there is no disturbance to a group from the other. However, if one of the groups talks too loud, it interferes with the conversations of the other group even if the languages are different. In this case, the disturbance is seen as interference.

2K+ Views
