
Article Categories
- All Categories
-
 Data Structure
-
 Networking
-
 RDBMS
RDBMS
-
 Operating System
-
 Java
Java
-
 MS Excel
-
 iOS
iOS
-
 HTML
HTML
-
 CSS
CSS
-
 Android
-
 Python
-
 C Programming
-
 C++
C++
-
 C#
C#
-
 MongoDB
-
 MySQL
MySQL
-
 Javascript
-
 PHP
PHP
-
 Economics & Finance
Selected Reading
What is the use of type = "h" in base R for plotting a graph?
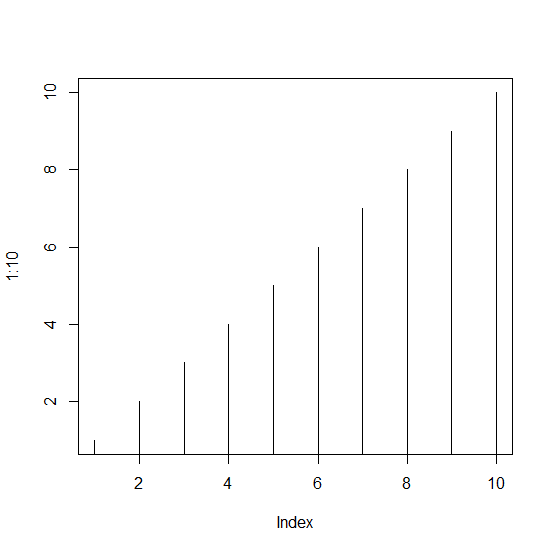
The type = "h" is a graphing argument in base R which is generally used inside a plot function. It helps to generate the vertical lines in the R environment instead of points. For example, if we want to plot values from 1 to 10 then type = "h" will plot the vertical lines starting from X-axis and the upper end of the lines will represent the actual value.
Example1
> plot(1:10,type="h")
Output:
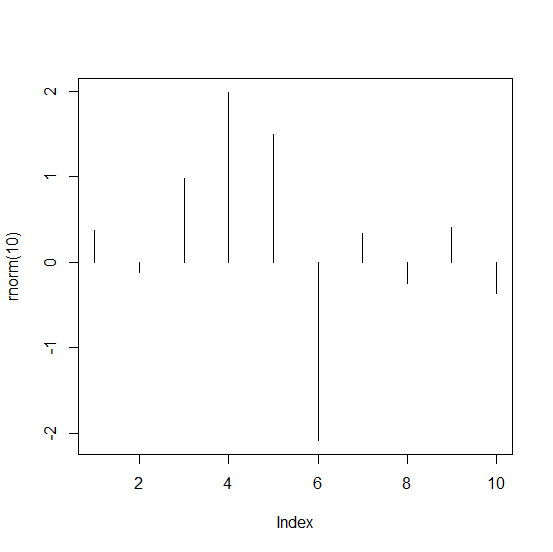
Example2
> plot(rnorm(10),type="h")
Output:

Updated on: 2026-03-11T22:50:53+05:30
3K+ Views

Advertisements