
Article Categories
- All Categories
-
 Data Structure
-
 Networking
-
 RDBMS
RDBMS
-
 Operating System
-
 Java
Java
-
 MS Excel
-
 iOS
iOS
-
 HTML
HTML
-
 CSS
CSS
-
 Android
-
 Python
-
 C Programming
-
 C++
C++
-
 C#
C#
-
 MongoDB
-
 MySQL
MySQL
-
 Javascript
-
 PHP
PHP
-
 Economics & Finance
Selected Reading
What is the use of pheatmap function in R?
The pheatmap function is used to create clustered heatmaps but we can change the aesthetics of the plot by using color argument which is one of the main functionalities of pheatmap function. There are many other arguments that differentiate pheatmap from heatmap function.
Example
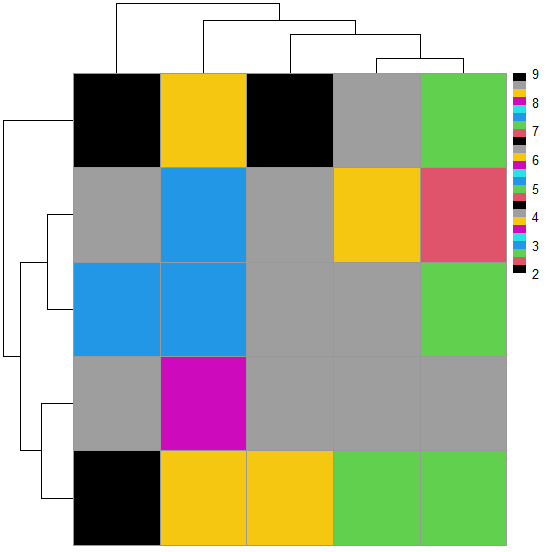
library(pheatmap)
M1<-matrix(rpois(25,5),ncol=5)
M1
Output
   [,1] [,2] [,3] [,4] [,5]
[1,] 3    4    6    4    7
[2,] 8    4    4    4    4
[3,] 3    4    4    3    5
[4,] 6    6    5    2    5
[5,] 6    2    4    9    5
Example
pheatmap(M1,color=1:25)
Output
Example
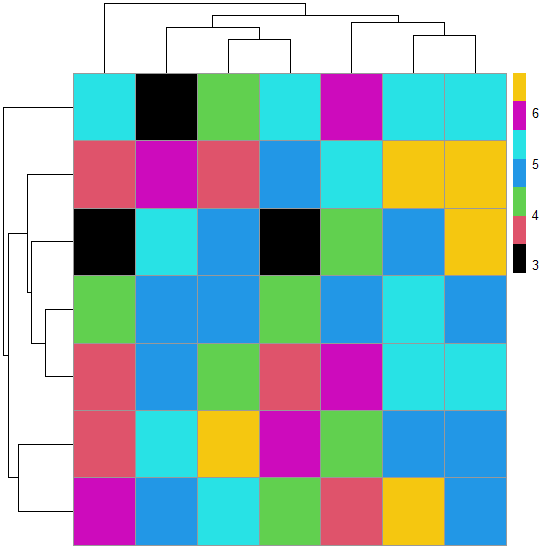
M2<-matrix(rnorm(49,5,1.1),ncol=7)
M2
Output
      [,1]       [,2]    [,3]       [,4]    [,5]    [,6]    [,7]
[1,] 4.778689 3.170058 3.236074 4.924220 6.344139 5.165052 4.430805
[2,] 6.251534 3.627046 5.744434 4.981911 4.974563 5.472041 4.414312
[3,] 4.559849 4.104897 4.471648 5.627426 4.560692 4.637538 4.764127
[4,] 3.696921 3.644598 4.884887 6.319531 6.758847 5.693916 5.416243
[5,] 4.047975 5.451307 5.103429 5.589361 5.633622 2.823698 5.769911
[6,] 4.203473 3.700089 3.900442 5.271490 5.186845 4.887599 6.051715
[7,] 5.328909 5.717243 4.478628 6.739882 4.761643 4.895137 3.506979
Example
pheatmap(M2,color=1:7)
Output

Updated on: 2026-03-11T22:50:54+05:30
207 Views

Advertisements