- Tables, Graphs, Functions and Sequences
- Home
- Making a table and plotting points given a unit rate
- Graphing whole number functions
- Function tables with two-step rules
- Writing a function rule given a table of ordered pairs: One-step rules
- Graphing a line in quadrant 1
- Interpreting a line graph
- Finding outputs of a one-step function that models a real-world situation
- Finding outputs of a two-step function with decimals that models a real-world situation
- Writing and evaluating a function that models a real-world situation: Basic
- Graphing ordered pairs and writing an equation from a table of values in context
- Writing an equation and drawing its graph to model a real-world situation: Basic
- Identifying independent and dependent quantities from tables and graphs
- Finding the next terms of an arithmetic sequence with whole numbers
- Finding the next terms of a geometric sequence with whole numbers
- Finding patterns in shapes
Selected Reading
Writing an equation and drawing its graph to model a real-world situation: Basic
Introduction
In this lesson, we solve real world problems which are modeled by an equation. The equation describing the problem is written and its graph is plotted.
Example 1
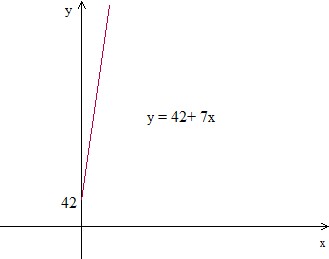
Jenny has savings of $42 and earns $7 for each hour of lawn mowing. If y is the total amount with Jenny and x is the number of hours he works, write and equation in y and x and graph it.
Solution
Step 1:
The equation representing the problem in x and y is
y = 42 + 7x
Step 2:
The plot is
Example 2
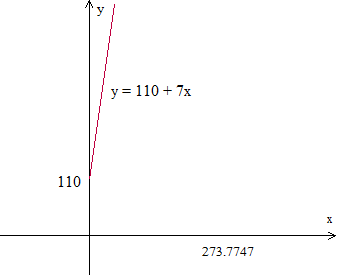
Phil's party costs $110 plus $7 for every guest he invites. Let y be the total cost of party and x be the number of guests. Write an equation in x and y and graph it.
Solution
Step 1:
The equation representing the problem in x and y is y =110 + 7x
Step 2:
The plot is

Advertisements