- System Analysis and Design - Home
- System Analysis & Design - Overview
- Differences between System Analysis and System Design
- System Analysis and Design - Communication Protocols
- Horizontal and Vertical Scaling in System Design
- Capacity Estimation in Systems Design
- Roles of Web Server and Proxies in Designing Systems
- Clustering and Load Balancing
- System Development Life Cycle
- System Analysis and Design - Requirement Determination
- System Analysis and Design - Systems Implementation
- System Analysis and Design - System Planning
- System Analysis and Design - Structured Analysis
- System Design
- System Analysis and Design - Design Strategies
- System Analysis and Design - Software Deployment
- Software Deployment Example Using Docker
- Functional Vs. Non-functional Requirements
- Data Flow Diagrams(DFD)
- Data Flow Diagram - What It Is?
- Data Flow Diagram - Types and Components
- Data Flow Diagram - Development
- Data Flow Diagram - Balancing
- Data Flow Diagram - Decomposition
- Databases in System Design
- System Design - Databases
- System Design - Database Sharding
- System Design - Database Replication
- System Design - Database Federation
- System Design - Designing Authentication System
- Database Design Vs. Database Architecture
- Database Federation Vs. Database Sharding
- High Level Design(HLD)
- System Design - High Level Design
- System Design - Availability
- System Design - Consistency
- System Design - Reliability
- System Design - CAP Theorem
- System Design - API Gateway
- Low Level Design(LLD)
- System Design - Low Level Design
- System Design - Authentication Vs. Authorization
- System Design - Performance Optimization Techniques
- System Design - Containerization Architecture
- System Design - Modularity and Interfaces
- System Design - CI/CD Pipelines
- System Design - Data Partitioning Techniques
- System Design - Essential Security Measures
- System Implementation
- Input / Output & Forms Design
- Testing and Quality Assurance
- Implementation & Maintenance
- System Security and Audit
- Object-Oriented Approach
- System Analysis & Design Resources
- Quick Guide
- Useful Resources
- Discussion
What is a Data Flow Diagram?
Introduction to Data Flow Diagrams
Definition of DFD
DFD can be explained as a graphical representation of the flow of data through a system.
Purpose and Importance
Used to visualize the movement of data and interactions within a system.
Helps developers, business analysts, and stakeholders understand the process without technical complexities.
Key Benefits
Simplifies complex processes.
Provides clarity in communication between technical and non-technical stakeholders.
DFD Components and Symbols
Processes− Represented by circles or rounded rectangles. Describe how each process transforms inputs into outputs.
Data Stores− Represented by open-ended rectangles, symbolizing where data is stored within the system.
Data Flows− Arrows indicate data movement between components, labelled with the type of data being transferred.
External Entities (Sources/Sinks)− Represented by squares, indicating external systems or users interacting with the system.
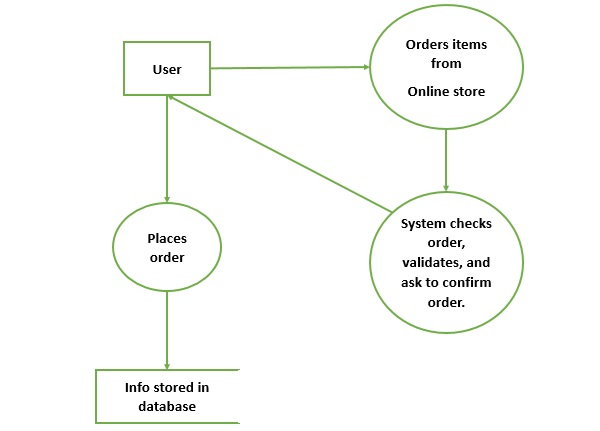
Example DFD with simple use case
Types and Levels of Data Flow Diagrams
Context Diagram (Level 0)− High-level DFD showing the entire system as a single process with external entities.
Level 1 DFD− Breaks down the main process into sub-processes with data flows and stores.
Level 2 and Beyond− Further decomposition for more detailed views, typically for large or complex systems.
Creating a Data Flow Diagram - Step-by-Step Guide
Step 1− Identify external entities (who/what interacts with the system).
Step 2− Define main processes (primary system functions).
Step 3− Map data flows between entities and processes.
Step 4− Identify data stores where information is stored for processing.
Step 5− Refine and add details by decomposing higher-level diagrams into lower levels if needed.
Tips− Use consistent labelling, avoid crossing lines where possible, and ensure all components have clear labels.
Examples of DFDs for Different Systems
Example 1− Online Retail System: Context diagram illustrating basic data flows (user, payment gateway, inventory). Level 1 DFD with processes like "Place Order," "Process Payment," "Manage Inventory.".
Example 2− Library Management System: Context diagram showing library staff, member, and database as entities. Level 1 DFD with processes like "Issue Book," "Return Book,", "Update Member Info.".
Example 3− Banking System: Context diagram illustrating customer, bank, and ATM as Level 1 DFD with processes such as "Deposit Funds", "Withdraw Funds", "Check Balance".
Use Cases of Data Flow Diagrams in Different Industries
Healthcare− Visualize patient data flow through different departments (e.g., admission, diagnostics, billing).
E-commerce− Illustrate customer journey from browsing to checkout and fulfilment.
Banking and Finance− Show data flow across ATMs, branches, and online platforms for transactions and account management.
Education− Depict the student lifecycle from registration to graduation, including course management and record keeping.
Case Study Example− Sample use case diagram for patient data management in a hospital.
Best Practices for Creating and Using Data Flow Diagrams
Keep it Simple− Avoid over-complicating; use hierarchical DFD levels for clarity.
Use Consistent Symbols and Labels− Standardize symbols for readability and clarity.
Avoid Overlapping Lines− Minimize visual clutter by arranging components clearly.
Validate with Stakeholders− Confirm with users and stakeholders to ensure accuracy.
Iterate and Refine− Revise as the system evolves, especially with complex projects.
Example Tips− Show a cluttered DFD vs. a well-organized DFD to highlight best practices.
Common Mistakes and How to Avoid Them
Undefined or Ambiguous Labels− Using clear, descriptive labels for all data flows and processes.
Too Much Detail in High-Level DFDs− Reserve finer details for lower levels to avoid clutter.
Missing Data Stores or Data Flows− Ensure all required data storage and movement are included.
Incorrect Placement of External Entities− Keep external entities at the periphery of the system.
Unconnected Processes− Ensure that each process has incoming and outgoing data flows.
Advanced Concepts and Future of Data Flow Diagrams
Extended DFDs
Using DFDs to illustrate event-based or real-time data flows.
Automated Tools for DFD Creation
Microsoft Visio, Lucidchart, and online DFD generators.
Benefits of automated tools
Quicker updates, easy sharing, and standardization.
Integrating DFDs with Other Diagrams
Combining DFDs with entity-relationship diagrams (ERDs) or use case diagrams for a holistic view.
Future of DFDs in Agile Environments
Potential for quick iterations, integration with user stories, and continued relevance in complex system designs.
Summary
This guide provides an in-depth understanding of DFDs, their purpose, structure, and best practices for creation and usage. DFDs remain valuable for system analysis and design, offering a straightforward way to understand data flows and system architecture.
