 Data Structure
 Networking
 RDBMS
RDBMS Operating System
 Java
Java MS Excel
 iOS
iOS HTML
HTML CSS
CSS Android
 Python
 C Programming
 C++
C++ C#
C# MongoDB
 MySQL
MySQL Javascript
 PHP
PHP
- Selected Reading
- UPSC IAS Exams Notes
- Developer's Best Practices
- Questions and Answers
- Effective Resume Writing
- HR Interview Questions
- Computer Glossary
- Who is Who
Singular Value Decomposition
Machine learning uses the mathematical approach of Singular value decomposition to comprehend huge and complicated data sets.
In this mathematical approach, a Unique Valued matrix A is factorized into three matrices via decomposition. In terms of the components of A, the Singular value decomposition of matrix A can be written as A=UDVT. In this case, S denotes A's singular values, whereas U and V stand for A's left and right singular vectors, respectively.
Mathematical Algorithm
Given Matrix A find the Transpose of matrix A that is (AT).
Find A*AT
Find the Eigen Vector of A*AT
Find the eigen vector using the formula A*AT - ? I = 0 , where I is equivalent order identity matrix of A.
Compute the singular values of A as the square root of the eigenvalues of ATA. The singular values are sorted in descending order.
-
We calculate the left and right singular vectors of A ?
For each singular value, find the corresponding eigenvector of AT A.
Each eigenvector is normalized to have a unit length.
The left singular vectors of A are the eigenvectors of A AT corresponding to the nonzero singular values of A.
The right singular vectors of A are the normalized eigenvectors of AT A.
-
The singular values of A, arranged in descending order, are represented by the diagonal entries of S.
Left singular vectors of A are represented by the columns of U
The columns of V represent the right singular vectors of A.
Example 1
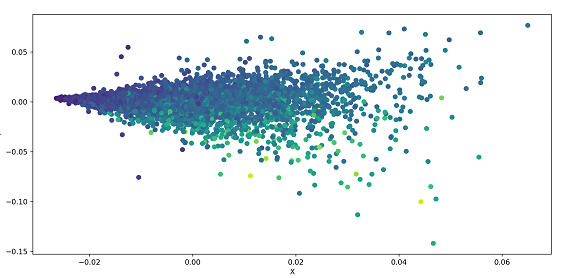
The following example performs SVD on a dataset and plots it as a scatter plot. A dataset is loaded from the UCI dataset and the data is segregated based on parameters. The data is standardized and the .svd() is applied to the data which is part of the linalg(linear algebra) module of Numpy.A scatter plot is used to plot the data.
Algorithm
Step 1 ? Import the Pandas, Numpy, and Matplotlib libraries.
Step 2 ? Store the link of the dataset in a url variable.
Step 3 ? Store the features i.e. the column names of the dataset in an array named names.
Step 4 ? Read the data using the pd.read_csv() method
Step 5 ? The features are separated from the target
Step 6 ? The features are standardized using the formula( X - Xmean) / Standard Deviation X
Step 7 ? SVD is performed on X using the .svd() method of linalg module of Numpy
Step 8 ? Diagonal Matrix S is constructed
Step 9 ? U is plotted using the .scatter() method of Matplotlib
Step 10 ? The scatter plot can be seen in the pop-up window after running the code
import pandas as pd
import numpy as np
import matplotlib.pyplot as plt


url='https://archive.ics.uci.edu/ml/machine-learning-databases/abalone/abalone.data'
names = ['Length', 'Diam', 'Height', 'Whole']
abalone = pd.read_csv(url, names=names)

X = abalone.iloc[:, :-1].values
y = abalone.iloc[:, -1].values

X = (X - X.mean(axis=0)) / X.std(axis=0)

U, s, Vt = np.linalg.svd(X, full_matrices=False)

S = np.diag(s)

plt.scatter(U[:, 0], U[:, 1], c=y)
plt.xlabel('X')
plt.ylabel('Y')
plt.show()
Output

Example 2
In the following example, we compute the SVD of a Matrix A which is passed as a parameter to a function. We calculate the eigenvectors and eigenvalues and sort them in descending order. The function returns the eigenvectors, singular values, and transpose of right singular matrix.
Algorithm
Step 1 ? Import the numpy library
Step 2 ? Define a function svd which takes a matrix A as input
Step 3 ? Calculate the eigenvalues and eigenvectors of A^T * A using the .eigh() method of the linalg method of Numpy.
Step 4 ? The eigenvectors and eigenvalues are sorted in descending order.
Step 5 ? Calculate the singular values and the right singular vectors of A
Step 6 ? The function returns the eigenvectors, singular values, and transpose of right singular matrix.
Step 7 ? Store values in the Array A and call the function svd with A as the parametre
Step 8 ? Store the values returned by the function in U,S,V respectively and print them
import numpy as np
def svd(A):
   eigen_values, eigen_vectors = np.linalg.eigh(np.dot(A.T, A))


   sorted_indices = eigen_values.argsort()[::-1]
   eigen_values = eigen_values[sorted_indices]
   eigen_vectors = eigen_vectors[:,sorted_indices]

   singular_values = np.sqrt(eigen_values)
   right_singular_vectors = np.dot(A, eigen_vectors)
   right_singular_vectors /= singular_values

   return eigen_vectors, singular_values, right_singular_vectors.T
A = np.array([[1, 2, 2], [4, 5, 9], [7, 8, 10]])
U, S, V = svd(A)
print (U)
print (S)
print (V)
In the above code, svd() function takes matrix as its input and calculates eigenvalues and eigenvectors of the matrix. We sort the calculated eigenvalues and eigenvectors in descending order and calculate the singular values by taking the square root of the eigenvalues and store them in an array.
We then calculate the right singular vectors by multiplying the matrix with the sorted eigenvectors and divide the resultant by singular values calculated before. The function thus returns the eigenvectors, singular values and transpose of right singular vectors.
Output
[[-0.43649583 -0.55427262 -0.70869828]
 [-0.52004753 -0.48734746  0.70145778]
 [-0.73418115  0.67474019 -0.07552297]]

[18.45494908  1.76319494  0.5531709 ]

[[-0.15957525 -0.59354546 -0.7888216 ]
 [-0.10179655  0.80469488 -0.58489624]
 [ 0.98192322 -0.01303565 -0.18883027]]
Conclusion
Single-value decomposition helps reduce data sets that contain a large number of values. In addition, this method helps to generate meaningful solutions for smaller values. However, these smaller values ??also contain enormous variability in the original data. SVD is used in Low-rank approximation in image compression, Low-rank approximation in recommender systems, Principal Component Analysis, and Linear Regression.

