- SAP APO - Home
- SAP APO - Introduction
- SAP APO - Deployment Options
- SAP APO - Architecture
- SAP APO - Supply Chain Monitoring
- SAP APO - Demand Planning
- Data Mart, Infocubes & Dp
- SAP APO - Supply Network Planning
- Supply & Demand Matching
- SAP APO - PP/DS
- SAP APO - Master Data Setup
- SAP APO - Transport Management
- Additional Functions in TP/VS
- SAP APO - Service Part Planning
- SAP APO - Core Interface
- SAP APO - Administration
- Cross Application Functions
- SAP APO - Managing Roles
- SAP APO - Archiving Data in APO
- Processing Customer Requirement
SAP APO - Demand Planning
Demand planning allows to perform forecasting of products in the market. The output of demand planning process is the demand plan which considers all the factors that affects the demand. The demand planning process defines the activity in Demand Planning cycle. As the demand planning process takes place in the form of a cycle, certain activities can be repeated.
Demand Planning Implementation
The successful setup of the demand planning process includes setting up the planning area. You need to identify the key figures to be used for demand planning. Actual data for demand planning and historical planning data is stored in InfoCube and the current planning data is stored in live cache time series objects.
In demand planning, you require a key figure for each department and business partner to create the forecast.
For each key figure, you have to decide whether you will also need key figures for corrected history, corrected forecast, promotions, ex-post forecast, and/or ex-post MLR forecast. If key figures do not exist in the system, you can create them.
Key Figures in Demand Planning
In demand planning, it contains data represented as a numerical value. It can be a quantity or a monetary value. There are three type of key figures commonly used under demand planning −
Quantity (To represent physical quantities)
Amount (To represent amount of money)
Number (To represent numerical values)
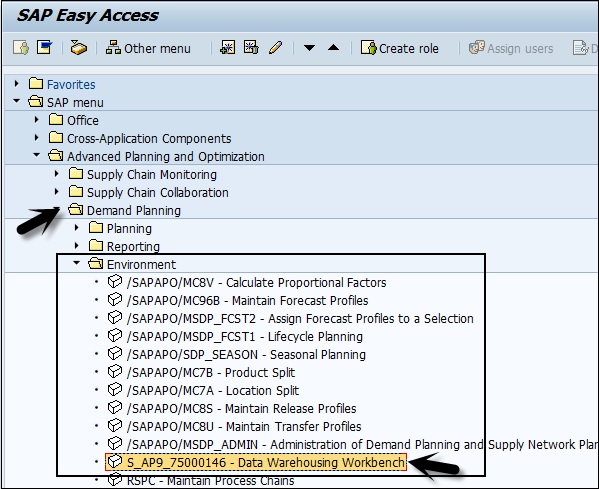
To create key figures, navigate to SAP Easy Access → Demand Planning → Environment → Data Warehousing Workbench.
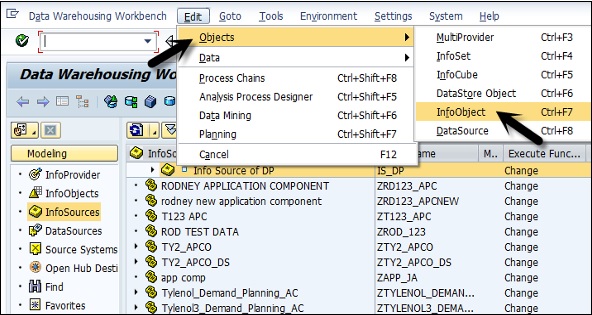
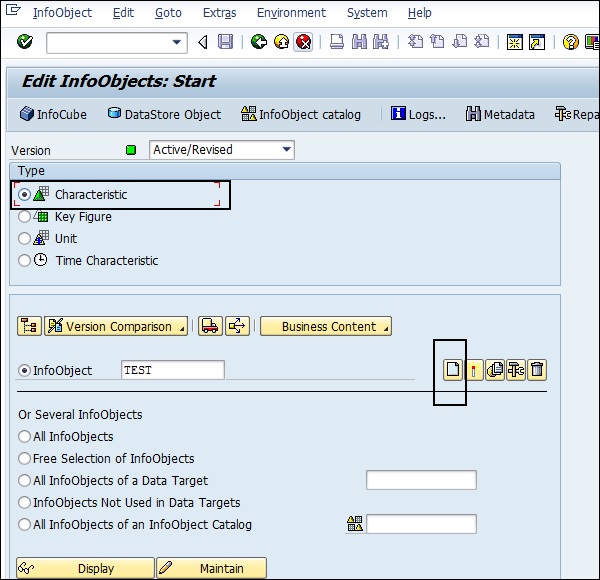
This will open the Administrative workbench. Go to Edit → Objects → InfoObjects.
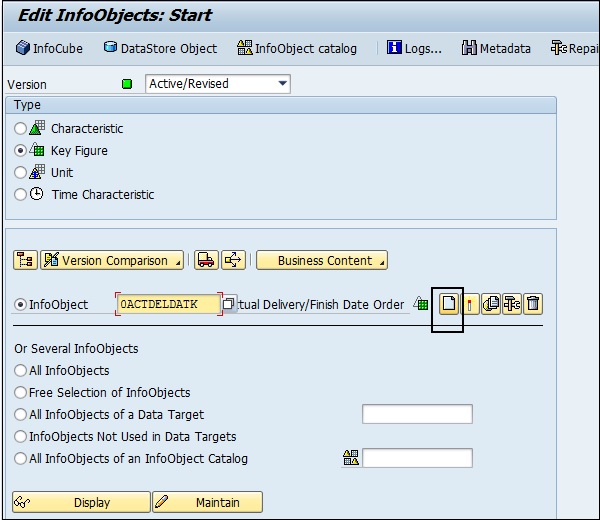
To create Key Figure, select type as Key figure. Enter InfoObject and click Create button.
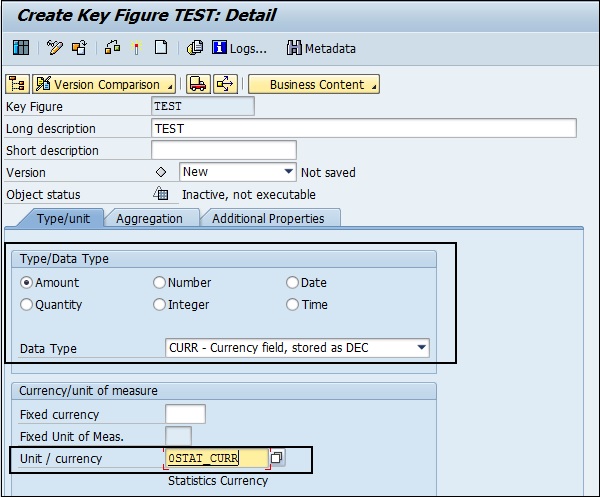
When creating a key figure for values, you have to select Amount and choose the data type "CURR". Enter the unit/currency "0STAT_CURR or 0Currency. For quantities, select "Quantity," choose the data type "QUAN", and enter the unit "0BASE_UOM or 0Unit.".
You can also create characteristics, define characteristics to be used at the planning level, or only for selection. In the Administrative workbench, if APO standard characteristics already exists in the system - "AMATNR" for product and "9ALOCNO" for location.
You can also create new characteristics by navigating to Edit → Objects → Edit InfoObjects in Administrative workbench.
You can create the characteristics you want to use as planning levels and the characteristics that will be used for selection and navigation.
Forecast Model Under Demand Planning
Forecast model has forecast profiles on which forecast calculations are based. You need to define the correct product for forecasting and the model to be used. You determine the best model in interactive planning either manually or automatically.
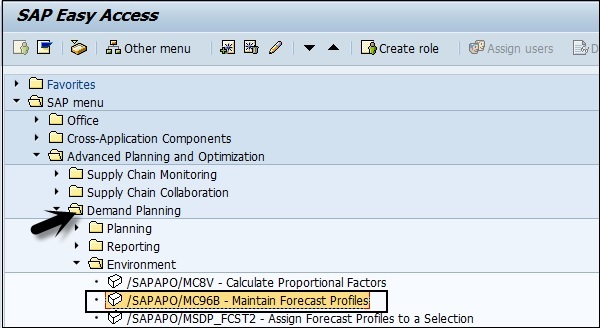
To create a master forecast profile, navigate to SAP Easy Access → Advanced Planning and Optimization → Demand Planning → Environment → Maintain Forecast Profile.
In Maintenance Forecast profile window, enter the details about the master forecast profile.
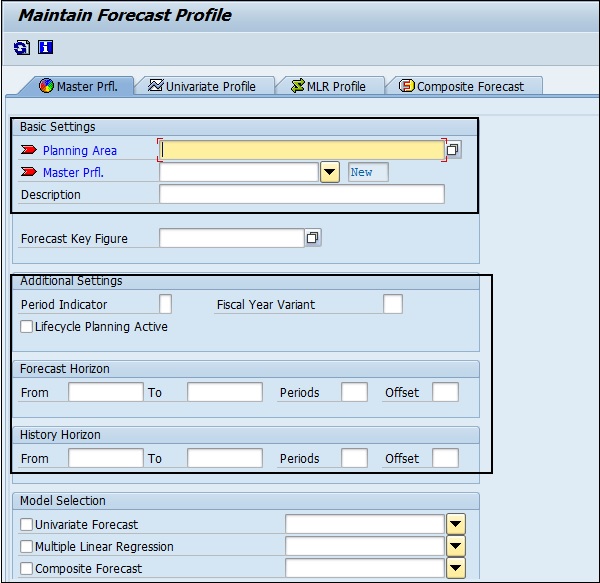
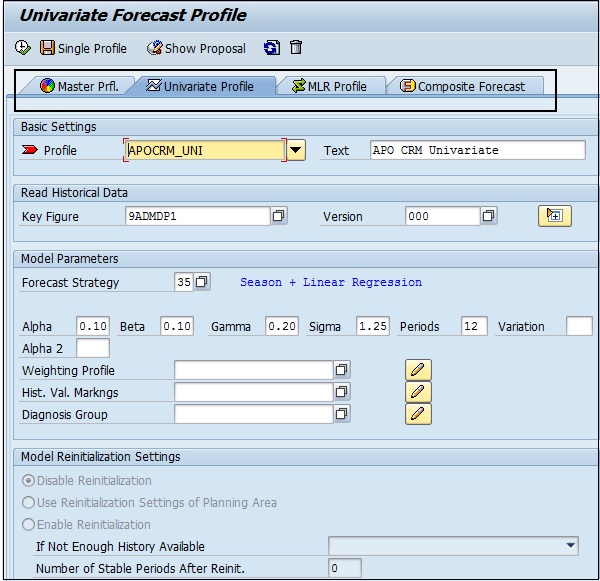
Create a univariate profile, a multiple linear regression profile, and a composite profile.
As per the requirement, choose Univariate Forecast, Multiple Linear Regression and Composite Forecast. Enter the forecast profile created in the previous step.
Save the master forecast profile.
Note − You can also store multiple planning scenarios for one product by using different versions.
Example
You can have three versions in a planning area containing three alternative demand forecasts for one product: one is created using a univariate profile, another is created using an MLR profile, and a third is created using a composite profile.
