 Data Structure
 Networking
 RDBMS
RDBMS Operating System
 Java
Java MS Excel
 iOS
iOS HTML
HTML CSS
CSS Android
 Python
 C Programming
 C++
C++ C#
C# MongoDB
 MySQL
MySQL Javascript
 PHP
PHP
- Selected Reading
- UPSC IAS Exams Notes
- Developer's Best Practices
- Questions and Answers
- Effective Resume Writing
- HR Interview Questions
- Computer Glossary
- Who is Who
Plot Line Graph from NumPy Array
A line graph is a common way to display the relationship between two dependent datasets. Its general purpose is to show change over time. To plot a line graph from the numpy array, we can use matplotlib which is the oldest and most widely used Python library for plotting. Also, it can be easily integrated with numpy which makes it easy to create line graphs to represent trends and patterns in the given datasets.
Python Program to Plot line graph from NumPy array
Here are the example programs that demonstrate how to plot line graphs from numpy array.
Example 1
In this program, we will generate a numpy array axisX with values ranging from 1 to 15 and then, create a corresponding array axisY using the sin method. To plot the line graph, we will use plot() method and also, we customize the graph with a title, and labels for the x and y axes.
# importing required packages
import numpy as np
import matplotlib.pyplot as plt
# To generate random data for plotting
axisX = np.linspace(1, 15, 50)
axisY = np.sin(axisX)
# To create the line graph from above data
plt.plot(axisX, axisY)
# Adding title and labels for the graph
plt.title('Line Graph')
plt.xlabel('X-axis')
plt.ylabel('Y-axis')
# to show the final graph
plt.show()
Output

Example 2
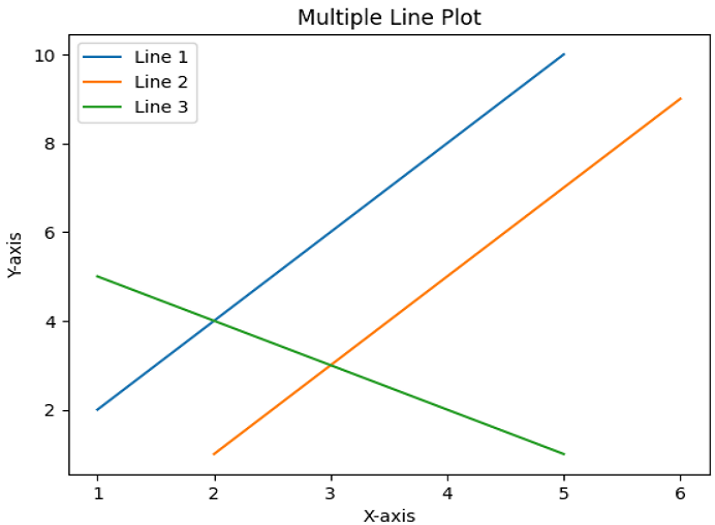
In this example, we will show the use of 'plot()' method in plotting multiple lines.
Approach
Import the numpy library with reference name 'np' and the pyplot module from the matplotlib library and renames it to plt.
Initialize three lines as data points using numpy array.
Use the 'plot()' method to plot the values of x-coordinate against the values of y-coordinate.
Then, add some information about plot using 'title', 'legend', 'xlabel' and 'ylabel'.
Display the result using 'show()' method and exit.
import numpy as np
import matplotlib.pyplot as plt
# Data points of line 1
x1 = np.array([1, 2, 3, 4, 5])
y1 = np.array([2, 4, 6, 8, 10])
# Data points of line 2
x2 = np.array([2, 3, 4, 5, 6])
y2 = np.array([1, 3, 5, 7, 9])
# Data points of line 3
x3 = np.array([1, 2, 3, 4, 5])
y3 = np.array([5, 4, 3, 2, 1])
# Plotting all lines with labels
plt.plot(x1, y1, label='Line 1')
plt.plot(x2, y2, label='Line 2')
plt.plot(x3, y3, label='Line 3')
# Adding legend, x and y labels, and title for the lines
plt.legend()
plt.xlabel('X-axis')
plt.ylabel('Y-axis')
plt.title('Multiple Line Plot')
# Displaying the plot
plt.show()
Output

Example 3
This is another example, where we will use the same code as the previous example to plot only two lines instead of three.
import matplotlib.pyplot as plt
import numpy as np
# Data points of line 1
x1 = np.array([1, 2, 3, 4, 5])
y1 = np.array([2, 4, 6, 8, 10])
# Data points of line 2
x2 = np.array([1, 2, 3, 4, 5])
y2 = np.array([1, 3, 5, 7, 9])
# Plotting all lines with specifying labels
plt.plot(x1, y1, label='Line 1')
plt.plot(x2, y2, label='Line 2')
# Adding legend, x and y labels, and titles for the lines
plt.legend()
plt.xlabel('X-axis')
plt.ylabel('Y-axis')
plt.title('Plotting Multiple Lines in single graph')
# Displaying the plot
plt.show()
Output

Conclusion
In this article, we have seen three example programs that show the use of plot() method in plotting line graphs from numpy array. This method is available in the matplotlib library. A line graph is one of the ways to visually represent complex trends and datasets.

