- OOAD - Home
- OOAD - Object Oriented Paradigm
- OOAD - Object Oriented Model
- OOAD - Object Oriented System
- OOAD - Object Oriented Principles
- OOAD - Object Oriented Analysis
- OOAD - Dynamic Modelling
- OOAD - Functional Modelling
- OOAD - UML Analysis Model
- OOAD - UML Basic Notations
- OOAD - UML Structural Diagrams
- OOAD - UML Behavioural Diagrams
- OOAD - Object Oriented Design
- OOAD - Implementation Strategies
- OOAD - Testing & Quality Assurance
OOAD - UML Structured Diagrams
UML structural diagrams are categorized as follows: class diagram, object diagram, component diagram, and deployment diagram.
Class Diagram
A class diagram models the static view of a system. It comprises of the classes, interfaces, and collaborations of a system; and the relationships between them.
Class Diagram of a System
Let us consider a simplified Banking System.
A bank has many branches. In each zone, one branch is designated as the zonal head office that supervises the other branches in that zone. Each branch can have multiple accounts and loans. An account may be either a savings account or a current account. A customer may open both a savings account and a current account. However, a customer must not have more than one savings account or current account. A customer may also procure loans from the bank.
The following figure shows the corresponding class diagram.
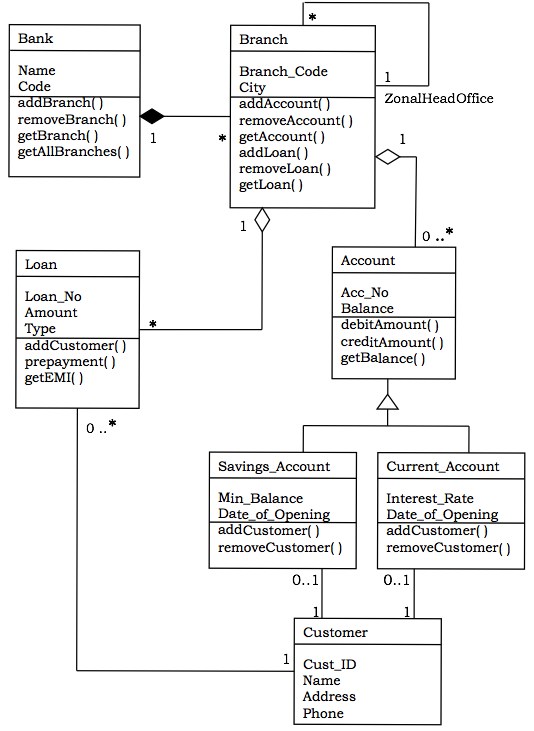
Classes in the system
Bank, Branch, Account, Savings Account, Current Account, Loan, and Customer.
Relationships
A Bank hasa number of Branches − composition, onetomany
A Branch with role Zonal Head Office supervises other Branches − unary association, oneto-many
A Branch hasa number of accounts − aggregation, onetomany
From the class Account, two classes have inherited, namely, Savings Account and Current Account.
A Customer can have one Current Account − association, onetoone
A Customer can have one Savings Account − association, onetoone
A Branch hasa number of Loans − aggregation, onetomany
A Customer can take many loans − association, onetomany
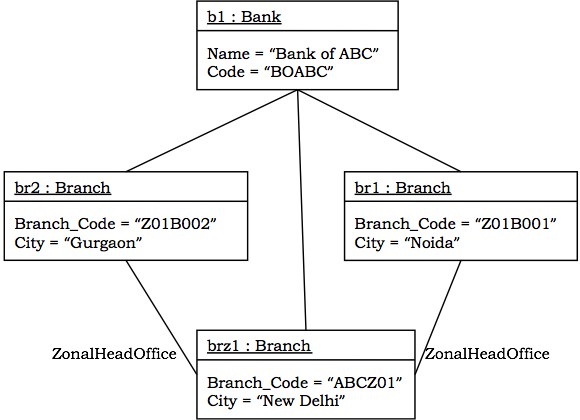
Object Diagram
An object diagram models a group of objects and their links at a point of time. It shows the instances of the things in a class diagram. Object diagram is the static part of an interaction diagram.
Example − The following figure shows an object diagram of a portion of the class diagram of the Banking System.
Component Diagram
Component diagrams show the organization and dependencies among a group of components.
Component diagrams comprise of −
- Components
- Interfaces
- Relationships
- Packages and Subsystems (optional)
Component diagrams are used for −
constructing systems through forward and reverse engineering.
modeling configuration management of source code files while developing a system using an object-oriented programming language.
representing schemas in modeling databases.
modeling behaviors of dynamic systems.
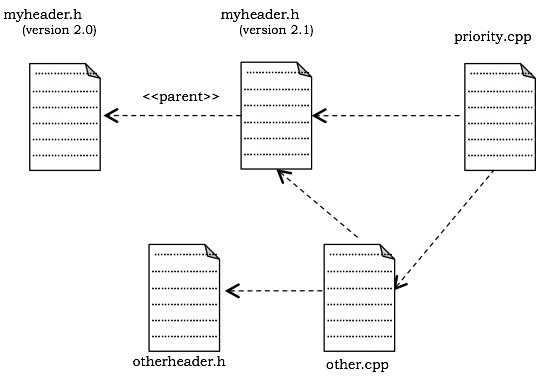
Example
The following figure shows a component diagram to model a systems source code that is developed using C++. It shows four source code files, namely, myheader.h, otherheader.h, priority.cpp, and other.cpp. Two versions of myheader.h are shown, tracing from the recent version to its ancestor. The file priority.cpp has compilation dependency on other.cpp. The file other.cpp has compilation dependency on otherheader.h.
Deployment Diagram
A deployment diagram puts emphasis on the configuration of runtime processing nodes and their components that live on them. They are commonly comprised of nodes and dependencies, or associations between the nodes.
Deployment diagrams are used to −
model devices in embedded systems that typically comprise of software-intensive collection of hardware.
represent the topologies of client/server systems.
model fully distributed systems.
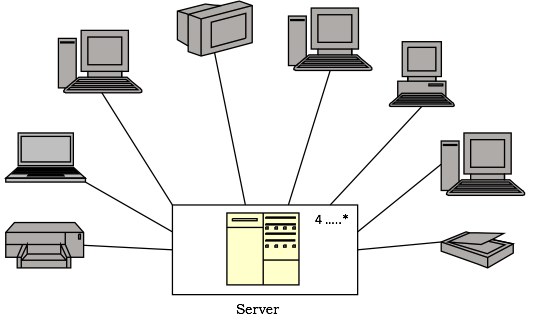
Example
The following figure shows the topology of a computer system that follows client/server architecture. The figure illustrates a node stereotyped as server that comprises of processors. The figure indicates that four or more servers are deployed at the system. Connected to the server are the client nodes, where each node represents a terminal device such as workstation, laptop, scanner, or printer. The nodes are represented using icons that clearly depict the real-world equivalent.