- OOAD - Home
- OOAD - Object Oriented Paradigm
- OOAD - Object Oriented Model
- OOAD - Object Oriented System
- OOAD - Object Oriented Principles
- OOAD - Object Oriented Analysis
- OOAD - Dynamic Modelling
- OOAD - Functional Modelling
- OOAD - UML Analysis Model
- OOAD - UML Basic Notations
- OOAD - UML Structural Diagrams
- OOAD - UML Behavioural Diagrams
- OOAD - Object Oriented Design
- OOAD - Implementation Strategies
- OOAD - Testing & Quality Assurance
OOAD - Quick Guide
OOAD - Object Oriented Paradigm
A Brief History
The object-oriented paradigm took its shape from the initial concept of a new programming approach, while the interest in design and analysis methods came much later.
The first objectoriented language was Simula (Simulation of real systems) that was developed in 1960 by researchers at the Norwegian Computing Center.
In 1970, Alan Kay and his research group at Xerox PARK created a personal computer named Dynabook and the first pure object-oriented programming language (OOPL) - Smalltalk, for programming the Dynabook.
In the 1980s, Grady Booch published a paper titled Object Oriented Design that mainly presented a design for the programming language, Ada. In the ensuing editions, he extended his ideas to a complete objectoriented design method.
In the 1990s, Coad incorporated behavioral ideas to object-oriented methods.
The other significant innovations were Object Modelling Techniques (OMT) by James Rumbaugh and Object-Oriented Software Engineering (OOSE) by Ivar Jacobson.
Object-Oriented Analysis
ObjectOriented Analysis (OOA) is the procedure of identifying software engineering requirements and developing software specifications in terms of a software systems object model, which comprises of interacting objects.
The main difference between object-oriented analysis and other forms of analysis is that in object-oriented approach, requirements are organized around objects, which integrate both data and functions. They are modelled after real-world objects that the system interacts with. In traditional analysis methodologies, the two aspects - functions and data - are considered separately.
Grady Booch has defined OOA as, Object-oriented analysis is a method of analysis that examines requirements from the perspective of the classes and objects found in the vocabulary of the problem domain.
The primary tasks in object-oriented analysis (OOA) are −
- Identifying objects
- Organizing the objects by creating object model diagram
- Defining the internals of the objects, or object attributes
- Defining the behavior of the objects, i.e., object actions
- Describing how the objects interact
The common models used in OOA are use cases andobject models.
Object-Oriented Design
ObjectOriented Design (OOD) involves implementation of the conceptual model produced during object-oriented analysis. In OOD, concepts in the analysis model, which are technologyindependent, are mapped onto implementing classes, constraints are identified and interfaces are designed, resulting in a model for the solution domain, i.e., a detailed description ofhowthe system is to be built on concrete technologies.
The implementation details generally include −
- Restructuring the class data (if necessary),
- Implementation of methods, i.e., internal data structures and algorithms,
- Implementation of control, and
- Implementation of associations.
Grady Booch has defined object-oriented design as a method of design encompassing the process of object-oriented decomposition and a notation for depicting both logical and physical as well as static and dynamic models of the system under design.
Object-Oriented Programming
Object-oriented programming(OOP) is aprogramming paradigmbased upon objects (having both data and methods) that aims to incorporate the advantages of modularity and reusability. Objects, which are usually instances of classes, are used to interact with one another to design applications and computer programs.
The important features of objectoriented programming are −
- Bottomup approach in program design
- Programs organized around objects, grouped in classes
- Focus on data with methods to operate upon objects data
- Interaction between objects through functions
- Reusability of design through creation of new classes by adding features to existing classes
Some examples of object-oriented programming languages are C++, Java, Smalltalk, Delphi, C#, Perl, Python, Ruby, and PHP.
Grady Booch has defined objectoriented programming as a method of implementation in which programs are organized as cooperative collections of objects, each of which represents an instance of some class, and whose classes are all members of a hierarchy of classes united via inheritance relationships.
OOAD - Object Model
The object modelvisualizes the elements in a software application in terms of objects. In this chapter, we will look into the basic concepts and terminologies of objectoriented systems.
Objects and Classes
The concepts of objects and classes are intrinsically linked with each other and form the foundation of objectoriented paradigm.
Object
An object is a real-world element in an objectoriented environment that may have a physical or a conceptual existence. Each object has −
Identity that distinguishes it from other objects in the system.
State that determines the characteristic properties of an object as well as the values of the properties that the object holds.
Behavior that represents externally visible activities performed by an object in terms of changes in its state.
Objects can be modelled according to the needs of the application. An object may have a physical existence, like a customer, a car, etc.; or an intangible conceptual existence, like a project, a process, etc.
Class
A class represents a collection of objects having same characteristic properties that exhibit common behavior. It gives the blueprint or description of the objects that can be created from it. Creation of an object as a member of a class is called instantiation. Thus, object is an instance of a class.
The constituents of a class are −
A set of attributes for the objects that are to be instantiated from the class. Generally, different objects of a class have some difference in the values of the attributes. Attributes are often referred as class data.
A set of operations that portray the behavior of the objects of the class. Operations are also referred as functions or methods.
Example
Let us consider a simple class, Circle, that represents the geometrical figure circle in a twodimensional space. The attributes of this class can be identified as follows −
- xcoord, to denote xcoordinate of the center
- ycoord, to denote ycoordinate of the center
- a, to denote the radius of the circle
Some of its operations can be defined as follows −
- findArea(), method to calculate area
- findCircumference(), method to calculate circumference
- scale(), method to increase or decrease the radius
During instantiation, values are assigned for at least some of the attributes. If we create an object my_circle, we can assign values like x-coord : 2, y-coord : 3, and a : 4 to depict its state. Now, if the operation scale() is performed on my_circle with a scaling factor of 2, the value of the variable a will become 8. This operation brings a change in the state of my_circle, i.e., the object has exhibited certain behavior.
Encapsulation and Data Hiding
Encapsulation
Encapsulation is the process of binding both attributes and methods together within a class. Through encapsulation, the internal details of a class can be hidden from outside. It permits the elements of the class to be accessed from outside only through the interface provided by the class.
Data Hiding
Typically, a class is designed such that its data (attributes) can be accessed only by its class methods and insulated from direct outside access. This process of insulating an objects data is called data hiding or information hiding.
Example
In the class Circle, data hiding can be incorporated by making attributes invisible from outside the class and adding two more methods to the class for accessing class data, namely −
- setValues(), method to assign values to x-coord, y-coord, and a
- getValues(), method to retrieve values of x-coord, y-coord, and a
Here the private data of the object my_circle cannot be accessed directly by any method that is not encapsulated within the class Circle. It should instead be accessed through the methods setValues() and getValues().
Message Passing
Any application requires a number of objects interacting in a harmonious manner. Objects in a system may communicate with each other using message passing. Suppose a system has two objects: obj1 and obj2. The object obj1 sends a message to object obj2, if obj1 wants obj2 to execute one of its methods.
The features of message passing are −
- Message passing between two objects is generally unidirectional.
- Message passing enables all interactions between objects.
- Message passing essentially involves invoking class methods.
- Objects in different processes can be involved in message passing.
Inheritance
Inheritance is the mechanism that permits new classes to be created out of existing classes by extending and refining its capabilities. The existing classes are called the base classes/parent classes/super-classes, and the new classes are called the derived classes/child classes/subclasses. The subclass can inherit or derive the attributes and methods of the super-class(es) provided that the super-class allows so. Besides, the subclass may add its own attributes and methods and may modify any of the super-class methods. Inheritance defines an is a relationship.
Example
From a class Mammal, a number of classes can be derived such as Human, Cat, Dog, Cow, etc. Humans, cats, dogs, and cows all have the distinct characteristics of mammals. In addition, each has its own particular characteristics. It can be said that a cow is a mammal.
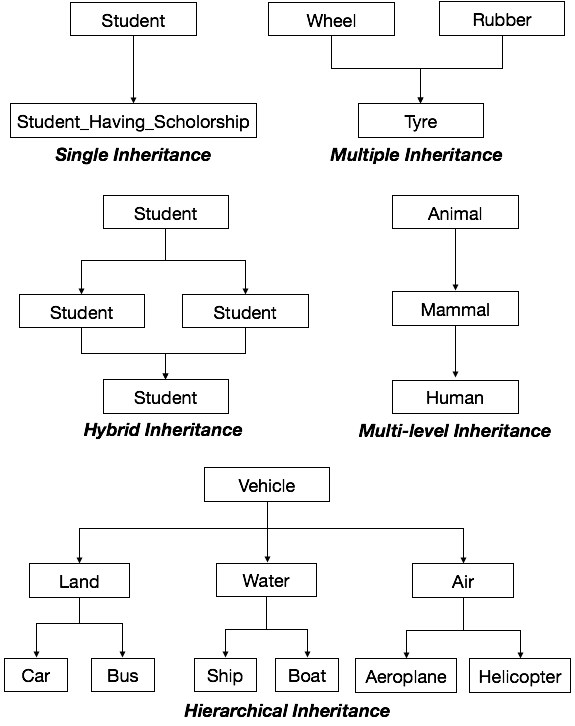
Types of Inheritance
Single Inheritance − A subclass derives from a single super-class.
Multiple Inheritance − A subclass derives from more than one super-classes.
Multilevel Inheritance − A subclass derives from a super-class which in turn is derived from another class and so on.
Hierarchical Inheritance − A class has a number of subclasses each of which may have subsequent subclasses, continuing for a number of levels, so as to form a tree structure.
Hybrid Inheritance − A combination of multiple and multilevel inheritance so as to form a lattice structure.
The following figure depicts the examples of different types of inheritance.
Polymorphism
Polymorphism is originally a Greek word that means the ability to take multiple forms. In object-oriented paradigm, polymorphism implies using operations in different ways, depending upon the instance they are operating upon. Polymorphism allows objects with different internal structures to have a common external interface. Polymorphism is particularly effective while implementing inheritance.
Example
Let us consider two classes, Circle and Square, each with a method findArea(). Though the name and purpose of the methods in the classes are same, the internal implementation, i.e., the procedure of calculating area is different for each class. When an object of class Circle invokes its findArea() method, the operation finds the area of the circle without any conflict with the findArea() method of the Square class.
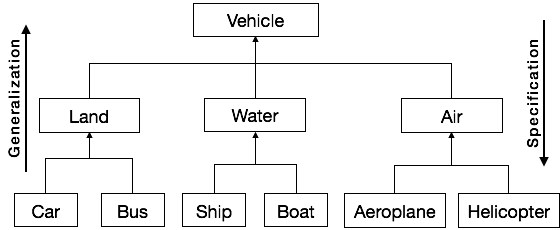
Generalization and Specialization
Generalization and specialization represent a hierarchy of relationships between classes, where subclasses inherit from super-classes.
Generalization
In the generalization process, the common characteristics of classes are combined to form a class in a higher level of hierarchy, i.e., subclasses are combined to form a generalized super-class. It represents an is a kind of relationship. For example, car is a kind of land vehicle, or ship is a kind of water vehicle.
Specialization
Specialization is the reverse process of generalization. Here, the distinguishing features of groups of objects are used to form specialized classes from existing classes. It can be said that the subclasses are the specialized versions of the super-class.
The following figure shows an example of generalization and specialization.
Links and Association
Link
A link represents a connection through which an object collaborates with other objects. Rumbaugh has defined it as a physical or conceptual connection between objects. Through a link, one object may invoke the methods or navigate through another object. A link depicts the relationship between two or more objects.
Association
Association is a group of links having common structure and common behavior. Association depicts the relationship between objects of one or more classes. A link can be defined as an instance of an association.
Degree of an Association
Degree of an association denotes the number of classes involved in a connection. Degree may be unary, binary, or ternary.
A unary relationship connects objects of the same class.
A binary relationship connects objects of two classes.
A ternary relationship connects objects of three or more classes.
Cardinality Ratios of Associations
Cardinality of a binary association denotes the number of instances participating in an association. There are three types of cardinality ratios, namely −
OnetoOne − A single object of class A is associated with a single object of class B.
OnetoMany − A single object of class A is associated with many objects of class B.
ManytoMany − An object of class A may be associated with many objects of class B and conversely an object of class B may be associated with many objects of class A.
Aggregation or Composition
Aggregation or composition is a relationship among classes by which a class can be made up of any combination of objects of other classes. It allows objects to be placed directly within the body of other classes. Aggregation is referred as a partof or hasa relationship, with the ability to navigate from the whole to its parts. An aggregate object is an object that is composed of one or more other objects.
Example
In the relationship, a car hasa motor, car is the whole object or the aggregate, and the motor is a partof the car. Aggregation may denote −
Physical containment − Example, a computer is composed of monitor, CPU, mouse, keyboard, and so on.
Conceptual containment − Example, shareholder hasa share.
Benefits of Object Model
Now that we have gone through the core concepts pertaining to object orientation, it would be worthwhile to note the advantages that this model has to offer.
The benefits of using the object model are −
It helps in faster development of software.
It is easy to maintain. Suppose a module develops an error, then a programmer can fix that particular module, while the other parts of the software are still up and running.
It supports relatively hassle-free upgrades.
It enables reuse of objects, designs, and functions.
It reduces development risks, particularly in integration of complex systems.
OOAD - Object Oriented System
We know that the Object-Oriented Modelling (OOM) technique visualizes things in an application by using models organized around objects. Any software development approach goes through the following stages −
- Analysis,
- Design, and
- Implementation.
In object-oriented software engineering, the software developer identifies and organizes the application in terms of object-oriented concepts, prior to their final representation in any specific programming language or software tools.
Phases in Object-Oriented Software Development
The major phases of software development using objectoriented methodology are object-oriented analysis, object-oriented design, and object-oriented implementation.
ObjectOriented Analysis
In this stage, the problem is formulated, user requirements are identified, and then a model is built based upon realworld objects. The analysis produces models on how the desired system should function and how it must be developed. The models do not include any implementation details so that it can be understood and examined by any nontechnical application expert.
ObjectOriented Design
Object-oriented design includes two main stages, namely, system design and object design.
System Design
In this stage, the complete architecture of the desired system is designed. The system is conceived as a set of interacting subsystems that in turn is composed of a hierarchy of interacting objects, grouped into classes. System design is done according to both the system analysis model and the proposed system architecture. Here, the emphasis is on the objects comprising the system rather than the processes in the system.
Object Design
In this phase, a design model is developed based on both the models developed in the system analysis phase and the architecture designed in the system design phase. All the classes required are identified. The designer decides whether −
- new classes are to be created from scratch,
- any existing classes can be used in their original form, or
- new classes should be inherited from the existing classes.
The associations between the identified classes are established and the hierarchies of classes are identified. Besides, the developer designs the internal details of the classes and their associations, i.e., the data structure for each attribute and the algorithms for the operations.
ObjectOriented Implementation and Testing
In this stage, the design model developed in the object design is translated into code in an appropriate programming language or software tool. The databases are created and the specific hardware requirements are ascertained. Once the code is in shape, it is tested using specialized techniques to identify and remove the errors in the code.
OOAD - Object Oriented Principles
Principles of Object-Oriented Systems
The conceptual framework of objectoriented systems is based upon the object model. There are two categories of elements in an object-oriented system −
Major Elements − By major, it is meant that if a model does not have any one of these elements, it ceases to be object oriented. The four major elements are −
- Abstraction
- Encapsulation
- Modularity
- Hierarchy
Minor Elements − By minor, it is meant that these elements are useful, but not indispensable part of the object model. The three minor elements are −
- Typing
- Concurrency
- Persistence
Abstraction
Abstraction means to focus on the essential features of an element or object in OOP, ignoring its extraneous or accidental properties. The essential features are relative to the context in which the object is being used.
Grady Booch has defined abstraction as follows −
An abstraction denotes the essential characteristics of an object that distinguish it from all other kinds of objects and thus provide crisply defined conceptual boundaries, relative to the perspective of the viewer.
Example − When a class Student is designed, the attributes enrolment_number, name, course, and address are included while characteristics like pulse_rate and size_of_shoe are eliminated, since they are irrelevant in the perspective of the educational institution.
Encapsulation
Encapsulation is the process of binding both attributes and methods together within a class. Through encapsulation, the internal details of a class can be hidden from outside. The class has methods that provide user interfaces by which the services provided by the class may be used.
Modularity
Modularity is the process of decomposing a problem (program) into a set of modules so as to reduce the overall complexity of the problem. Booch has defined modularity as −
Modularity is the property of a system that has been decomposed into a set of cohesive and loosely coupled modules.
Modularity is intrinsically linked with encapsulation. Modularity can be visualized as a way of mapping encapsulated abstractions into real, physical modules having high cohesion within the modules and their intermodule interaction or coupling is low.
Hierarchy
In Grady Boochs words, Hierarchy is the ranking or ordering of abstraction. Through hierarchy, a system can be made up of interrelated subsystems, which can have their own subsystems and so on until the smallest level components are reached. It uses the principle of divide and conquer. Hierarchy allows code reusability.
The two types of hierarchies in OOA are −
ISA hierarchy − It defines the hierarchical relationship in inheritance, whereby from a super-class, a number of subclasses may be derived which may again have subclasses and so on. For example, if we derive a class Rose from a class Flower, we can say that a rose isa flower.
PARTOF hierarchy − It defines the hierarchical relationship in aggregation by which a class may be composed of other classes. For example, a flower is composed of sepals, petals, stamens, and carpel. It can be said that a petal is a partof flower.
Typing
According to the theories of abstract data type, a type is a characterization of a set of elements. In OOP, a class is visualized as a type having properties distinct from any other types. Typing is the enforcement of the notion that an object is an instance of a single class or type. It also enforces that objects of different types may not be generally interchanged; and can be interchanged only in a very restricted manner if absolutely required to do so.
The two types of typing are −
Strong Typing − Here, the operation on an object is checked at the time of compilation, as in the programming language Eiffel.
Weak Typing − Here, messages may be sent to any class. The operation is checked only at the time of execution, as in the programming language Smalltalk.
Concurrency
Concurrency in operating systems allows performing multiple tasks or processes simultaneously. When a single process exists in a system, it is said that there is a single thread of control. However, most systems have multiple threads, some active, some waiting for CPU, some suspended, and some terminated. Systems with multiple CPUs inherently permit concurrent threads of control; but systems running on a single CPU use appropriate algorithms to give equitable CPU time to the threads so as to enable concurrency.
In an object-oriented environment, there are active and inactive objects. The active objects have independent threads of control that can execute concurrently with threads of other objects. The active objects synchronize with one another as well as with purely sequential objects.
Persistence
An object occupies a memory space and exists for a particular period of time. In traditional programming, the lifespan of an object was typically the lifespan of the execution of the program that created it. In files or databases, the object lifespan is longer than the duration of the process creating the object. This property by which an object continues to exist even after its creator ceases to exist is known as persistence.
OOAD - Object Oriented Analysis
In the system analysis or object-oriented analysis phase of software development, the system requirements are determined, the classes are identified and the relationships among classes are identified.
The three analysis techniques that are used in conjunction with each other for object-oriented analysis are object modelling, dynamic modelling, and functional modelling.
Object Modelling
Object modelling develops the static structure of the software system in terms of objects. It identifies the objects, the classes into which the objects can be grouped into and the relationships between the objects. It also identifies the main attributes and operations that characterize each class.
The process of object modelling can be visualized in the following steps −
- Identify objects and group into classes
- Identify the relationships among classes
- Create user object model diagram
- Define user object attributes
- Define the operations that should be performed on the classes
- Review glossary
Dynamic Modelling
After the static behavior of the system is analyzed, its behavior with respect to time and external changes needs to be examined. This is the purpose of dynamic modelling.
Dynamic Modelling can be defined as a way of describing how an individual object responds to events, either internal events triggered by other objects, or external events triggered by the outside world.
The process of dynamic modelling can be visualized in the following steps −
- Identify states of each object
- Identify events and analyze the applicability of actions
- Construct dynamic model diagram, comprising of state transition diagrams
- Express each state in terms of object attributes
- Validate the statetransition diagrams drawn
Functional Modelling
Functional Modelling is the final component of object-oriented analysis. The functional model shows the processes that are performed within an object and how the data changes as it moves between methods. It specifies the meaning of the operations of object modelling and the actions of dynamic modelling. The functional model corresponds to the data flow diagram of traditional structured analysis.
The process of functional modelling can be visualized in the following steps −
- Identify all the inputs and outputs
- Construct data flow diagrams showing functional dependencies
- State the purpose of each function
- Identify constraints
- Specify optimization criteria
Structured Analysis vs. Object Oriented Analysis
The Structured Analysis/Structured Design (SASD) approach is the traditional approach of software development based upon the waterfall model. The phases of development of a system using SASD are −
- Feasibility Study
- Requirement Analysis and Specification
- System Design
- Implementation
- Post-implementation Review
Now, we will look at the relative advantages and disadvantages of structured analysis approach and object-oriented analysis approach.
Advantages/Disadvantages of Object Oriented Analysis
| Advantages | Disadvantages |
|---|---|
| Focuses on data rather than the procedures as in Structured Analysis. | Functionality is restricted within objects. This may pose a problem for systems which are intrinsically procedural or computational in nature. |
| The principles of encapsulation and data hiding help the developer to develop systems that cannot be tampered by other parts of the system. | It cannot identify which objects would generate an optimal system design. |
| The principles of encapsulation and data hiding help the developer to develop systems that cannot be tampered by other parts of the system. | The object-oriented models do not easily show the communications between the objects in the system. |
| It allows effective management of software complexity by the virtue of modularity. | All the interfaces between the objects cannot be represented in a single diagram. |
| It can be upgraded from small to large systems at a greater ease than in systems following structured analysis. |
Advantages/Disadvantages of Structured Analysis
| Advantages | Disadvantages |
|---|---|
| As it follows a top-down approach in contrast to bottom-up approach of object-oriented analysis, it can be more easily comprehended than OOA. | In traditional structured analysis models, one phase should be completed before the next phase. This poses a problem in design, particularly if errors crop up or requirements change. |
| It is based upon functionality. The overall purpose is identified and then functional decomposition is done for developing the software. The emphasis not only gives a better understanding of the system but also generates more complete systems. | The initial cost of constructing the system is high, since the whole system needs to be designed at once leaving very little option to add functionality later. |
| The specifications in it are written in simple English language, and hence can be more easily analyzed by non-technical personnel. | It does not support reusability of code. So, the time and cost of development is inherently high. |
OOAD - Dynamic Modeling
The dynamic model represents the timedependent aspects of a system. It is concerned with the temporal changes in the states of the objects in a system. The main concepts are −
State, which is the situation at a particular condition during the lifetime of an object.
Transition, a change in the state
Event, an occurrence that triggers transitions
Action, an uninterrupted and atomic computation that occurs due to some event, and
Concurrency of transitions.
A state machine models the behavior of an object as it passes through a number of states in its lifetime due to some events as well as the actions occurring due to the events. A state machine is graphically represented through a state transition diagram.
States and State Transitions
State
The state is an abstraction given by the values of the attributes that the object has at a particular time period. It is a situation occurring for a finite time period in the lifetime of an object, in which it fulfils certain conditions, performs certain activities, or waits for certain events to occur. In state transition diagrams, a state is represented by rounded rectangles.
Parts of a state
Name − A string differentiates one state from another. A state may not have any name.
Entry/Exit Actions − It denotes the activities performed on entering and on exiting the state.
Internal Transitions − The changes within a state that do not cause a change in the state.
Substates − States within states.
Initial and Final States
The default starting state of an object is called its initial state. The final state indicates the completion of execution of the state machine. The initial and the final states are pseudo-states, and may not have the parts of a regular state except name. In state transition diagrams, the initial state is represented by a filled black circle. The final state is represented by a filled black circle encircled within another unfilled black circle.
Transition
A transition denotes a change in the state of an object. If an object is in a certain state when an event occurs, the object may perform certain activities subject to specified conditions and change the state. In this case, a statetransition is said to have occurred. The transition gives the relationship between the first state and the new state. A transition is graphically represented by a solid directed arc from the source state to the destination state.
The five parts of a transition are −
Source State − The state affected by the transition.
Event Trigger − The occurrence due to which an object in the source state undergoes a transition if the guard condition is satisfied.
Guard Condition − A Boolean expression which if True, causes a transition on receiving the event trigger.
Action − An un-interruptible and atomic computation that occurs on the source object due to some event.
Target State − The destination state after completion of transition.
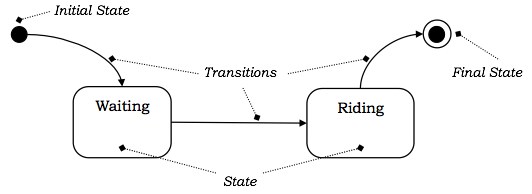
Example
Suppose a person is taking a taxi from place X to place Y. The states of the person may be: Waiting (waiting for taxi), Riding (he has got a taxi and is travelling in it), and Reached (he has reached the destination). The following figure depicts the state transition.
Events
Events are some occurrences that can trigger state transition of an object or a group of objects. Events have a location in time and space but do not have a time period associated with it. Events are generally associated with some actions.
Examples of events are mouse click, key press, an interrupt, stack overflow, etc.
Events that trigger transitions are written alongside the arc of transition in state diagrams.
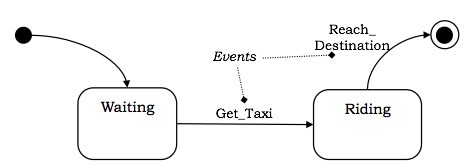
Example
Considering the example shown in the above figure, the transition from Waiting state to Riding state takes place when the person gets a taxi. Likewise, the final state is reached, when he reaches the destination. These two occurrences can be termed as events Get_Taxi and Reach_Destination. The following figure shows the events in a state machine.
External and Internal Events
External events are those events that pass from a user of the system to the objects within the system. For example, mouse click or keypress by the user are external events.
Internal events are those that pass from one object to another object within a system. For example, stack overflow, a divide error, etc.
Deferred Events
Deferred events are those which are not immediately handled by the object in the current state but are lined up in a queue so that they can be handled by the object in some other state at a later time.
Event Classes
Event class indicates a group of events with common structure and behavior. As with classes of objects, event classes may also be organized in a hierarchical structure. Event classes may have attributes associated with them, time being an implicit attribute. For example, we can consider the events of departure of a flight of an airline, which we can group into the following class −
Flight_Departs (Flight_No, From_City, To_City, Route)
Actions
Activity
Activity is an operation upon the states of an object that requires some time period. They are the ongoing executions within a system that can be interrupted. Activities are shown in activity diagrams that portray the flow from one activity to another.
Action
An action is an atomic operation that executes as a result of certain events. By atomic, it is meant that actions are un-interruptible, i.e., if an action starts executing, it runs into completion without being interrupted by any event. An action may operate upon an object on which an event has been triggered or on other objects that are visible to this object. A set of actions comprise an activity.
Entry and Exit Actions
Entry action is the action that is executed on entering a state, irrespective of the transition that led into it.
Likewise, the action that is executed while leaving a state, irrespective of the transition that led out of it, is called an exit action.
Scenario
Scenario is a description of a specified sequence of actions. It depicts the behavior of objects undergoing a specific action series. The primary scenarios depict the essential sequences and the secondary scenarios depict the alternative sequences.
Diagrams for Dynamic Modelling
There are two primary diagrams that are used for dynamic modelling −
Interaction Diagrams
Interaction diagrams describe the dynamic behavior among different objects. It comprises of a set of objects, their relationships, and the message that the objects send and receive. Thus, an interaction models the behavior of a group of interrelated objects. The two types of interaction diagrams are −
Sequence Diagram − It represents the temporal ordering of messages in a tabular manner.
Collaboration Diagram − It represents the structural organization of objects that send and receive messages through vertices and arcs.
State Transition Diagram
State transition diagrams or state machines describe the dynamic behavior of a single object. It illustrates the sequences of states that an object goes through in its lifetime, the transitions of the states, the events and conditions causing the transition and the responses due to the events.
Concurrency of Events
In a system, two types of concurrency may exist. They are −
System Concurrency
Here, concurrency is modelled in the system level. The overall system is modelled as the aggregation of state machines, where each state machine executes concurrently with others.
Concurrency within an Object
Here, an object can issue concurrent events. An object may have states that are composed of sub-states, and concurrent events may occur in each of the sub-states.
Concepts related to concurrency within an object are as follows −
Simple and Composite States
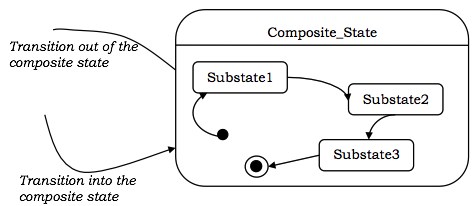
A simple state has no sub-structure. A state that has simpler states nested inside it is called a composite state. A sub-state is a state that is nested inside another state. It is generally used to reduce the complexity of a state machine. Sub-states can be nested to any number of levels.
Composite states may have either sequential sub-states or concurrent sub-states.
Sequential Sub-states
In sequential sub-states, the control of execution passes from one sub-state to another sub-state one after another in a sequential manner. There is at most one initial state and one final state in these state machines.
The following figure illustrates the concept of sequential sub-states.
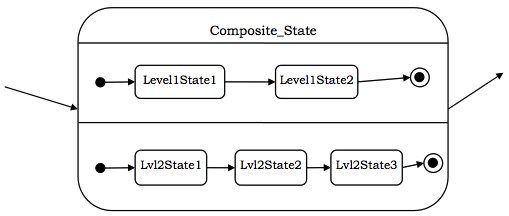
Concurrent Sub-states
In concurrent sub-states, the sub-states execute in parallel, or in other words, each state has concurrently executing state machines within it. Each of the state machines has its own initial and final states. If one concurrent sub-state reaches its final state before the other, control waits at its final state. When all the nested state machines reach their final states, the sub-states join back to a single flow.
The following figure shows the concept of concurrent sub-states.
OOAD - Functional Modeling
Functional Modelling gives the process perspective of the object-oriented analysis model and an overview of what the system is supposed to do. It defines the function of the internal processes in the system with the aid of Data Flow Diagrams (DFDs). It depicts the functional derivation of the data values without indicating how they are derived when they are computed, or why they need to be computed.
Data Flow Diagrams
Functional Modelling is represented through a hierarchy of DFDs. The DFD is a graphical representation of a system that shows the inputs to the system, the processing upon the inputs, the outputs of the system as well as the internal data stores. DFDs illustrate the series of transformations or computations performed on the objects or the system, and the external controls and objects that affect the transformation.
Rumbaugh et al. have defined DFD as, A data flow diagram is a graph which shows the flow of data values from their sources in objects through processes that transform them to their destinations on other objects.
The four main parts of a DFD are −
- Processes,
- Data Flows,
- Actors, and
- Data Stores.
The other parts of a DFD are −
- Constraints, and
- Control Flows.
Features of a DFD
Processes
Processes are the computational activities that transform data values. A whole system can be visualized as a high-level process. A process may be further divided into smaller components. The lowest-level process may be a simple function.
Representation in DFD − A process is represented as an ellipse with its name written inside it and contains a fixed number of input and output data values.
Example − The following figure shows a process Compute_HCF_LCM that accepts two integers as inputs and outputs their HCF (highest common factor) and LCM (least common multiple).
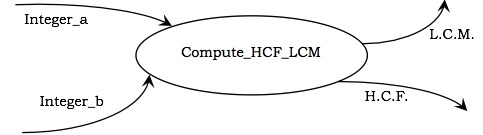
Data Flows
Data flow represents the flow of data between two processes. It could be between an actor and a process, or between a data store and a process. A data flow denotes the value of a data item at some point of the computation. This value is not changed by the data flow.
Representation in DFD − A data flow is represented by a directed arc or an arrow, labelled with the name of the data item that it carries.
In the above figure, Integer_a and Integer_b represent the input data flows to the process, while L.C.M. and H.C.F. are the output data flows.
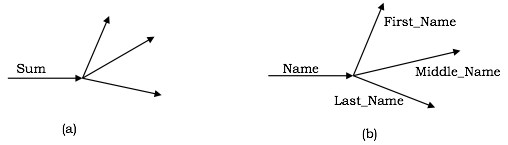
A data flow may be forked in the following cases −
The output value is sent to several places as shown in the following figure. Here, the output arrows are unlabelled as they denote the same value.
The data flow contains an aggregate value, and each of the components is sent to different places as shown in the following figure. Here, each of the forked components is labelled.
Actors
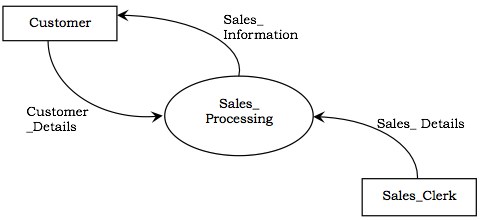
Actors are the active objects that interact with the system by either producing data and inputting them to the system, or consuming data produced by the system. In other words, actors serve as the sources and the sinks of data.
Representation in DFD − An actor is represented by a rectangle. Actors are connected to the inputs and outputs and lie on the boundary of the DFD.
Example − The following figure shows the actors, namely, Customer and Sales_Clerk in a counter sales system.
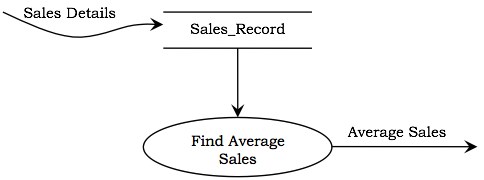
Data Stores
Data stores are the passive objects that act as a repository of data. Unlike actors, they cannot perform any operations. They are used to store data and retrieve the stored data. They represent a data structure, a disk file, or a table in a database.
Representation in DFD − A data store is represented by two parallel lines containing the name of the data store. Each data store is connected to at least one process. Input arrows contain information to modify the contents of the data store, while output arrows contain information retrieved from the data store. When a part of the information is to be retrieved, the output arrow is labelled. An unlabelled arrow denotes full data retrieval. A two-way arrow implies both retrieval and update.
Example − The following figure shows a data store, Sales_Record, that stores the details of all sales. Input to the data store comprises of details of sales such as item, billing amount, date, etc. To find the average sales, the process retrieves the sales records and computes the average.
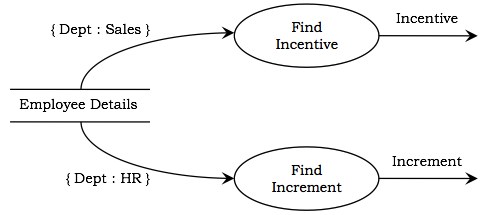
Constraints
Constraints specify the conditions or restrictions that need to be satisfied over time. They allow adding new rules or modifying existing ones. Constraints can appear in all the three models of object-oriented analysis.
In Object Modelling, the constraints define the relationship between objects. They may also define the relationship between the different values that an object may take at different times.
In Dynamic Modelling, the constraints define the relationship between the states and events of different objects.
In Functional Modelling, the constraints define the restrictions on the transformations and computations.
Representation − A constraint is rendered as a string within braces.
Example − The following figure shows a portion of DFD for computing the salary of employees of a company that has decided to give incentives to all employees of the sales department and increment the salary of all employees of the HR department. It can be seen that the constraint {Dept:Sales} causes incentive to be calculated only if the department is sales and the constraint {Dept:HR} causes increment to be computed only if the department is HR.
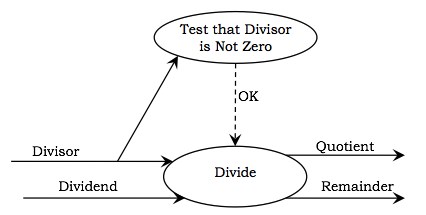
Control Flows
A process may be associated with a certain Boolean value and is evaluated only if the value is true, though it is not a direct input to the process. These Boolean values are called the control flows.
Representation in DFD − Control flows are represented by a dotted arc from the process producing the Boolean value to the process controlled by them.
Example − The following figure represents a DFD for arithmetic division. The Divisor is tested for non-zero. If it is not zero, the control flow OK has a value True and subsequently the Divide process computes the Quotient and the Remainder.
Developing the DFD Model of a System
In order to develop the DFD model of a system, a hierarchy of DFDs are constructed. The top-level DFD comprises of a single process and the actors interacting with it.
At each successive lower level, further details are gradually included. A process is decomposed into sub-processes, the data flows among the sub-processes are identified, the control flows are determined, and the data stores are defined. While decomposing a process, the data flow into or out of the process should match the data flow at the next level of DFD.
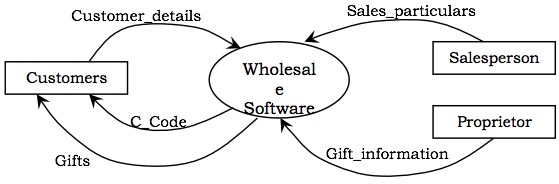
Example − Let us consider a software system, Wholesaler Software, that automates the transactions of a wholesale shop. The shop sells in bulks and has a clientele comprising of merchants and retail shop owners. Each customer is asked to register with his/her particulars and is given a unique customer code, C_Code. Once a sale is done, the shop registers its details and sends the goods for dispatch. Each year, the shop distributes Christmas gifts to its customers, which comprise of a silver coin or a gold coin depending upon the total sales and the decision of the proprietor.
The functional model for the Wholesale Software is given below. The figure below shows the top-level DFD. It shows the software as a single process and the actors that interact with it.
The actors in the system are −
- Customers
- Salesperson
- Proprietor
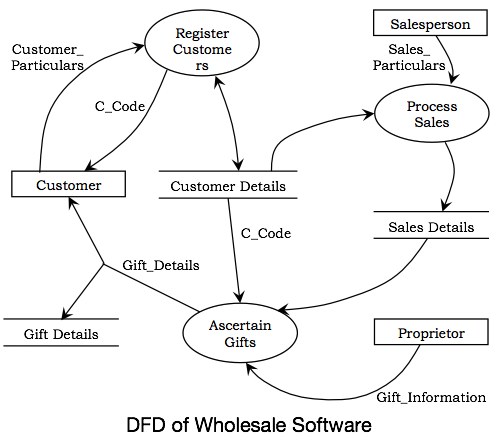
In the next level DFD, as shown in the following figure, the major processes of the system are identified, the data stores are defined and the interaction of the processes with the actors, and the data stores are established.
In the system, three processes can be identified, which are −
- Register Customers
- Process Sales
- Ascertain Gifts
The data stores that will be required are −
- Customer Details
- Sales Details
- Gift Details
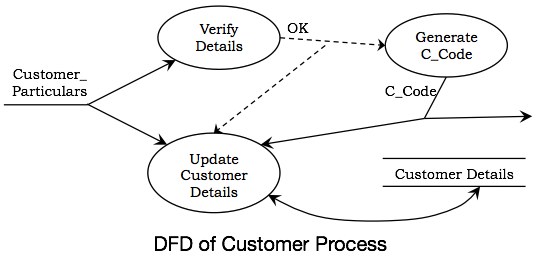
The following figure shows the details of the process Register Customer. There are three processes in it, Verify Details, Generate C_Code, and Update Customer Details. When the details of the customer are entered, they are verified. If the data is correct, C_Code is generated and the data store Customer Details is updated.
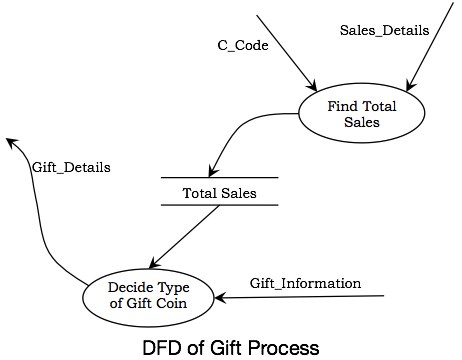
The following figure shows the expansion of the process Ascertain Gifts. It has two processes in it, Find Total Sales and Decide Type of Gift Coin. The Find Total Sales process computes the yearly total sales corresponding to each customer and records the data. Taking this record and the decision of the proprietor as inputs, the gift coins are allotted through Decide Type of Gift Coin process.
Advantages and Disadvantages of DFD
| Advantages | Disadvantages |
|---|---|
| DFDs depict the boundaries of a system and hence are helpful in portraying the relationship between the external objects and the processes within the system. | DFDs take a long time to create, which may not be feasible for practical purposes. |
| They help the users to have a knowledge about the system. | DFDs do not provide any information about the time-dependent behavior, i.e., they do not specify when the transformations are done. |
| The graphical representation serves as a blueprint for the programmers to develop a system. | They do not throw any light on the frequency of computations or the reasons for computations. |
| DFDs provide detailed information about the system processes. | The preparation of DFDs is a complex process that needs considerable expertise. Also, it is difficult for a non-technical person to understand. |
| They are used as a part of the system documentation. | The method of preparation is subjective and leaves ample scope to be imprecise. |
Relationship between Object, Dynamic, and Functional Models
The Object Model, the Dynamic Model, and the Functional Model are complementary to each other for a complete Object-Oriented Analysis.
Object modelling develops the static structure of the software system in terms of objects. Thus it shows the doers of a system.
Dynamic Modelling develops the temporal behavior of the objects in response to external events. It shows the sequences of operations performed on the objects.
Functional model gives an overview of what the system should do.
Functional Model and Object Model
The four main parts of a Functional Model in terms of object model are −
Process − Processes imply the methods of the objects that need to be implemented.
Actors − Actors are the objects in the object model.
Data Stores − These are either objects in the object model or attributes of objects.
Data Flows − Data flows to or from actors represent operations on or by objects. Data flows to or from data stores represent queries or updates.
Functional Model and Dynamic Model
The dynamic model states when the operations are performed, while the functional model states how they are performed and which arguments are needed. As actors are active objects, the dynamic model has to specify when it acts. The data stores are passive objects and they only respond to updates and queries; therefore the dynamic model need not specify when they act.
Object Model and Dynamic Model
The dynamic model shows the status of the objects and the operations performed on the occurrences of events and the subsequent changes in states. The state of the object as a result of the changes is shown in the object model.
OOAD - UML Analysis Model
The Unified Modeling Language (UML) is a graphical language for OOAD that gives a standard way to write a software systems blueprint. It helps to visualize, specify, construct, and document the artifacts of an object-oriented system. It is used to depict the structures and the relationships in a complex system.
Brief History
It was developed in 1990s as an amalgamation of several techniques, prominently OOAD technique by Grady Booch, OMT (Object Modeling Technique) by James Rumbaugh, and OOSE (Object Oriented Software Engineering) by Ivar Jacobson. UML attempted to standardize semantic models, syntactic notations, and diagrams of OOAD.
Systems and Models in UML
System − A set of elements organized to achieve certain objectives form a system. Systems are often divided into subsystems and described by a set of models.
Model − Model is a simplified, complete, and consistent abstraction of a system, created for better understanding of the system.
View − A view is a projection of a systems model from a specific perspective.
Conceptual Model of UML
The Conceptual Model of UML encompasses three major elements −
- Basic building blocks
- Rules
- Common mechanisms
Basic Building Blocks
The three building blocks of UML are −
- Things
- Relationships
- Diagrams
Things
There are four kinds of things in UML, namely −
Structural Things − These are the nouns of the UML models representing the static elements that may be either physical or conceptual. The structural things are class, interface, collaboration, use case, active class, components, and nodes.
Behavioral Things − These are the verbs of the UML models representing the dynamic behavior over time and space. The two types of behavioral things are interaction and state machine.
Grouping Things − They comprise the organizational parts of the UML models. There is only one kind of grouping thing, i.e., package.
Annotational Things − These are the explanations in the UML models representing the comments applied to describe elements.
Relationships
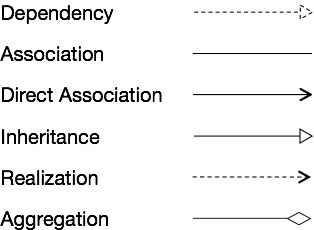
Relationships are the connection between things. The four types of relationships that can be represented in UML are −
Dependency − This is a semantic relationship between two things such that a change in one thing brings a change in the other. The former is the independent thing, while the latter is the dependent thing.
Association − This is a structural relationship that represents a group of links having common structure and common behavior.
Generalization − This represents a generalization/specialization relationship in which subclasses inherit structure and behavior from super-classes.
Realization − This is a semantic relationship between two or more classifiers such that one classifier lays down a contract that the other classifiers ensure to abide by.
Diagrams
A diagram is a graphical representation of a system. It comprises of a group of elements generally in the form of a graph. UML includes nine diagrams in all, namely −
- Class Diagram
- Object Diagram
- Use Case Diagram
- Sequence Diagram
- Collaboration Diagram
- State Chart Diagram
- Activity Diagram
- Component Diagram
- Deployment Diagram
Rules
UML has a number of rules so that the models are semantically self-consistent and related to other models in the system harmoniously. UML has semantic rules for the following −
- Names
- Scope
- Visibility
- Integrity
- Execution
Common Mechanisms
UML has four common mechanisms −
- Specifications
- Adornments
- Common Divisions
- Extensibility Mechanisms
Specifications
In UML, behind each graphical notation, there is a textual statement denoting the syntax and semantics. These are the specifications. The specifications provide a semantic backplane that contains all the parts of a system and the relationship among the different paths.
Adornments
Each element in UML has a unique graphical notation. Besides, there are notations to represent the important aspects of an element like name, scope, visibility, etc.
Common Divisions
Object-oriented systems can be divided in many ways. The two common ways of division are −
Division of classes and objects − A class is an abstraction of a group of similar objects. An object is the concrete instance that has actual existence in the system.
Division of Interface and Implementation − An interface defines the rules for interaction. Implementation is the concrete realization of the rules defined in the interface.
Extensibility Mechanisms
UML is an open-ended language. It is possible to extend the capabilities of UML in a controlled manner to suit the requirements of a system. The extensibility mechanisms are −
Stereotypes − It extends the vocabulary of the UML, through which new building blocks can be created out of existing ones.
Tagged Values − It extends the properties of UML building blocks.
Constraints − It extends the semantics of UML building blocks.
OOAD - UML Basic Notations
UML defines specific notations for each of the building blocks.
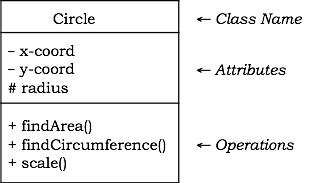
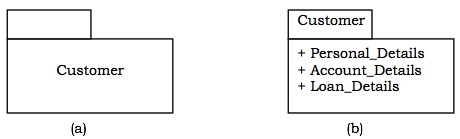
Class
A class is represented by a rectangle having three sections −
- the top section containing the name of the class
- the middle section containing class attributes
- the bottom section representing operations of the class
The visibility of the attributes and operations can be represented in the following ways −
Public − A public member is visible from anywhere in the system. In class diagram, it is prefixed by the symbol +.
Private − A private member is visible only from within the class. It cannot be accessed from outside the class. A private member is prefixed by the symbol .
Protected − A protected member is visible from within the class and from the subclasses inherited from this class, but not from outside. It is prefixed by the symbol #.
An abstract class has the class name written in italics.
Example − Let us consider the Circle class introduced earlier. The attributes of Circle are x-coord, y-coord, and radius. The operations are findArea(), findCircumference(), and scale(). Let us assume that x-coord and y-coord are private data members, radius is a protected data member, and the member functions are public. The following figure gives the diagrammatic representation of the class.
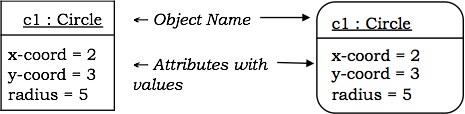
Object
An object is represented as a rectangle with two sections −
The top section contains the name of the object with the name of the class or package of which it is an instance of. The name takes the following forms −
object-name − class-name
object-name − class-name :: package-name
class-name − in case of anonymous objects
The bottom section represents the values of the attributes. It takes the form attribute-name = value.
Sometimes objects are represented using rounded rectangles.
Example − Let us consider an object of the class Circle named c1. We assume that the center of c1 is at (2, 3) and the radius of c1 is 5. The following figure depicts the object.
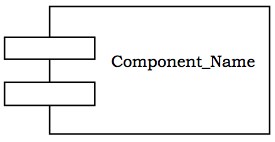
Component
A component is a physical and replaceable part of the system that conforms to and provides the realization of a set of interfaces. It represents the physical packaging of elements like classes and interfaces.
Notation − In UML diagrams, a component is represented by a rectangle with tabs as shown in the figure below.
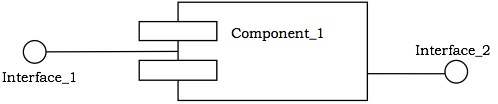
Interface
Interface is a collection of methods of a class or component. It specifies the set of services that may be provided by the class or component.
Notation − Generally, an interface is drawn as a circle together with its name. An interface is almost always attached to the class or component that realizes it. The following figure gives the notation of an interface.
Package
A package is an organized group of elements. A package may contain structural things like classes, components, and other packages in it.
Notation − Graphically, a package is represented by a tabbed folder. A package is generally drawn with only its name. However it may have additional details about the contents of the package. See the following figures.
Relationship
The notations for the different types of relationships are as follows −
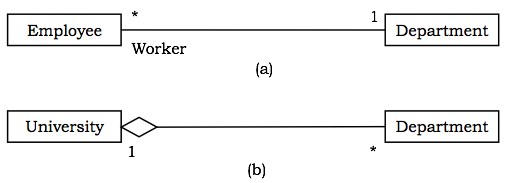
Usually, elements in a relationship play specific roles in the relationship. A role name signifies the behavior of an element participating in a certain context.
Example − The following figures show examples of different relationships between classes. The first figure shows an association between two classes, Department and Employee, wherein a department may have a number of employees working in it. Worker is the role name. The 1 alongside Department and * alongside Employee depict that the cardinality ratio is onetomany. The second figure portrays the aggregation relationship, a University is the wholeof many Departments.
OOAD - UML Structured Diagrams
UML structural diagrams are categorized as follows: class diagram, object diagram, component diagram, and deployment diagram.
Class Diagram
A class diagram models the static view of a system. It comprises of the classes, interfaces, and collaborations of a system; and the relationships between them.
Class Diagram of a System
Let us consider a simplified Banking System.
A bank has many branches. In each zone, one branch is designated as the zonal head office that supervises the other branches in that zone. Each branch can have multiple accounts and loans. An account may be either a savings account or a current account. A customer may open both a savings account and a current account. However, a customer must not have more than one savings account or current account. A customer may also procure loans from the bank.
The following figure shows the corresponding class diagram.
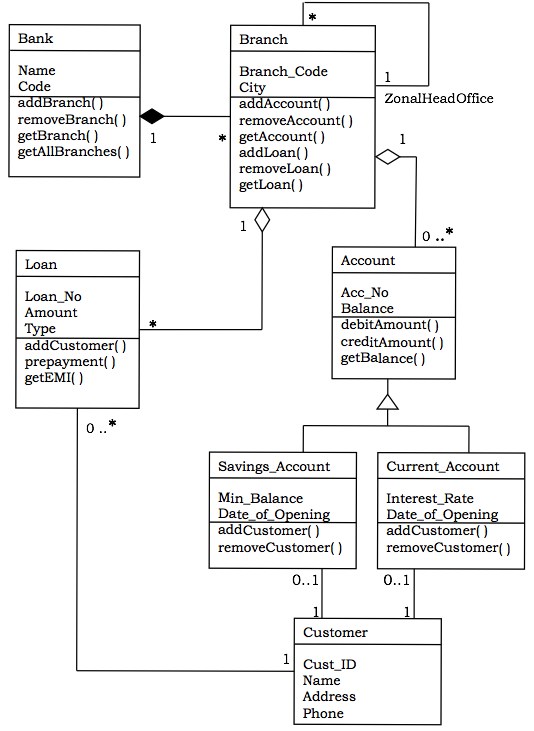
Classes in the system
Bank, Branch, Account, Savings Account, Current Account, Loan, and Customer.
Relationships
A Bank hasa number of Branches − composition, onetomany
A Branch with role Zonal Head Office supervises other Branches − unary association, oneto-many
A Branch hasa number of accounts − aggregation, onetomany
From the class Account, two classes have inherited, namely, Savings Account and Current Account.
A Customer can have one Current Account − association, onetoone
A Customer can have one Savings Account − association, onetoone
A Branch hasa number of Loans − aggregation, onetomany
A Customer can take many loans − association, onetomany
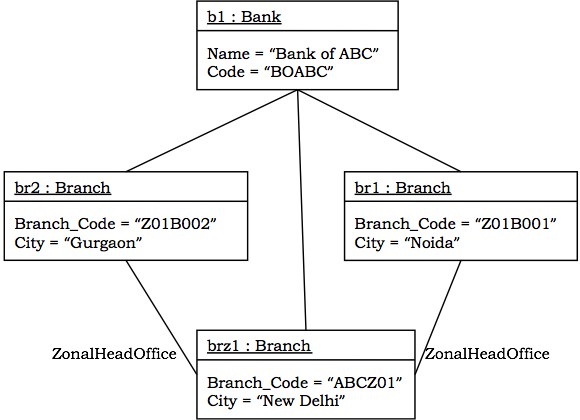
Object Diagram
An object diagram models a group of objects and their links at a point of time. It shows the instances of the things in a class diagram. Object diagram is the static part of an interaction diagram.
Example − The following figure shows an object diagram of a portion of the class diagram of the Banking System.
Component Diagram
Component diagrams show the organization and dependencies among a group of components.
Component diagrams comprise of −
- Components
- Interfaces
- Relationships
- Packages and Subsystems (optional)
Component diagrams are used for −
constructing systems through forward and reverse engineering.
modeling configuration management of source code files while developing a system using an object-oriented programming language.
representing schemas in modeling databases.
modeling behaviors of dynamic systems.
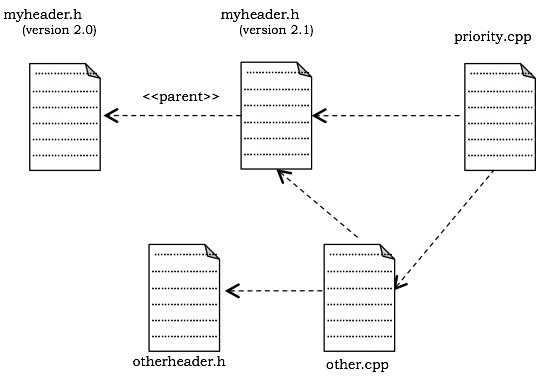
Example
The following figure shows a component diagram to model a systems source code that is developed using C++. It shows four source code files, namely, myheader.h, otherheader.h, priority.cpp, and other.cpp. Two versions of myheader.h are shown, tracing from the recent version to its ancestor. The file priority.cpp has compilation dependency on other.cpp. The file other.cpp has compilation dependency on otherheader.h.
Deployment Diagram
A deployment diagram puts emphasis on the configuration of runtime processing nodes and their components that live on them. They are commonly comprised of nodes and dependencies, or associations between the nodes.
Deployment diagrams are used to −
model devices in embedded systems that typically comprise of software-intensive collection of hardware.
represent the topologies of client/server systems.
model fully distributed systems.
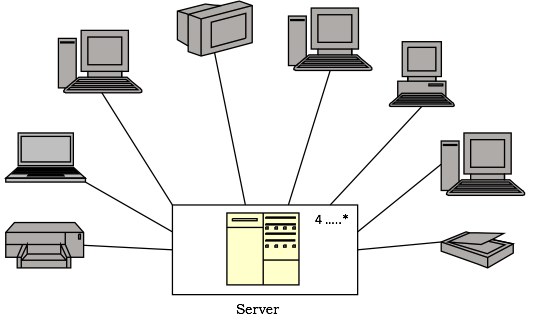
Example
The following figure shows the topology of a computer system that follows client/server architecture. The figure illustrates a node stereotyped as server that comprises of processors. The figure indicates that four or more servers are deployed at the system. Connected to the server are the client nodes, where each node represents a terminal device such as workstation, laptop, scanner, or printer. The nodes are represented using icons that clearly depict the real-world equivalent.
OOAD - UML Behavioural Diagrams
UML behavioral diagrams visualize, specify, construct, and document the dynamic aspects of a system. The behavioral diagrams are categorized as follows: use case diagrams, interaction diagrams, statechart diagrams, and activity diagrams.
Use Case Model
Use case
A use case describes the sequence of actions a system performs yielding visible results. It shows the interaction of things outside the system with the system itself. Use cases may be applied to the whole system as well as a part of the system.
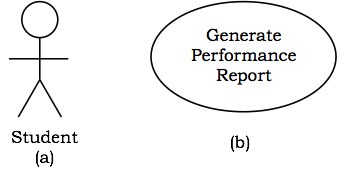
Actor
An actor represents the roles that the users of the use cases play. An actor may be a person (e.g. student, customer), a device (e.g. workstation), or another system (e.g. bank, institution).
The following figure shows the notations of an actor named Student and a use case called Generate Performance Report.
Use case diagrams
Use case diagrams present an outside view of the manner the elements in a system behave and how they can be used in the context.
Use case diagrams comprise of −
- Use cases
- Actors
- Relationships like dependency, generalization, and association
Use case diagrams are used −
To model the context of a system by enclosing all the activities of a system within a rectangle and focusing on the actors outside the system by interacting with it.
To model the requirements of a system from the outside point of view.
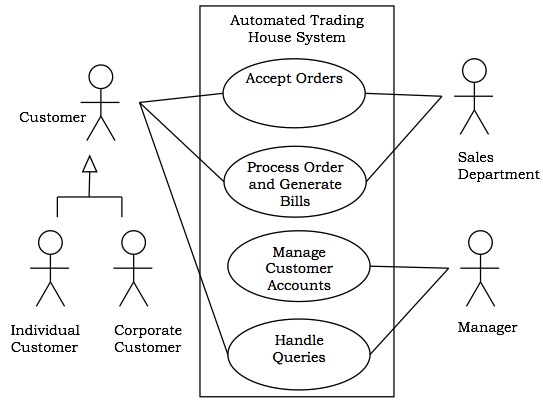
Example
Let us consider an Automated Trading House System. We assume the following features of the system −
The trading house has transactions with two types of customers, individual customers and corporate customers.
Once the customer places an order, it is processed by the sales department and the customer is given the bill.
The system allows the manager to manage customer accounts and answer any queries posted by the customer.
Interaction Diagrams
Interaction diagrams depict interactions of objects and their relationships. They also include the messages passed between them. There are two types of interaction diagrams −
- Sequence Diagrams
- Collaboration Diagrams
Interaction diagrams are used for modeling −
the control flow by time ordering using sequence diagrams.
the control flow of organization using collaboration diagrams.
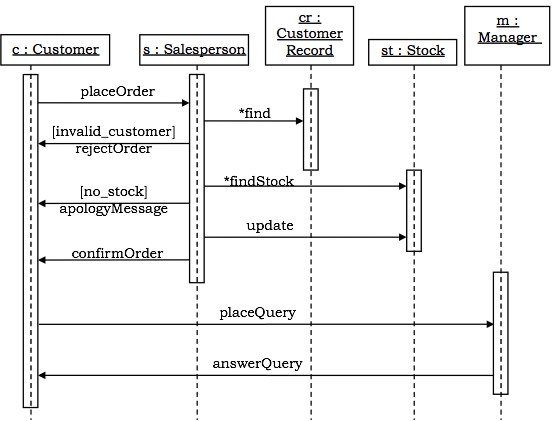
Sequence Diagrams
Sequence diagrams are interaction diagrams that illustrate the ordering of messages according to time.
Notations − These diagrams are in the form of two-dimensional charts. The objects that initiate the interaction are placed on the xaxis. The messages that these objects send and receive are placed along the yaxis, in the order of increasing time from top to bottom.
Example − A sequence diagram for the Automated Trading House System is shown in the following figure.
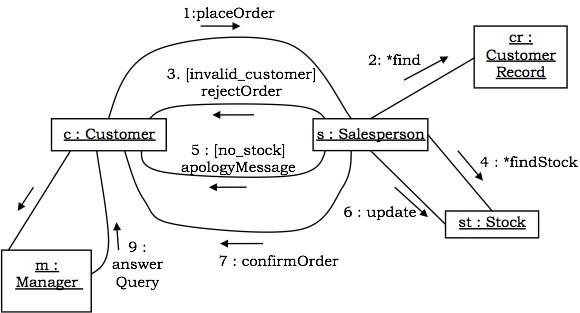
Collaboration Diagrams
Collaboration diagrams are interaction diagrams that illustrate the structure of the objects that send and receive messages.
Notations − In these diagrams, the objects that participate in the interaction are shown using vertices. The links that connect the objects are used to send and receive messages. The message is shown as a labeled arrow.
Example − Collaboration diagram for the Automated Trading House System is illustrated in the figure below.
StateChart Diagrams
A statechart diagram shows a state machine that depicts the control flow of an object from one state to another. A state machine portrays the sequences of states which an object undergoes due to events and their responses to events.
StateChart Diagrams comprise of −
- States: Simple or Composite
- Transitions between states
- Events causing transitions
- Actions due to the events
State-chart diagrams are used for modeling objects which are reactive in nature.
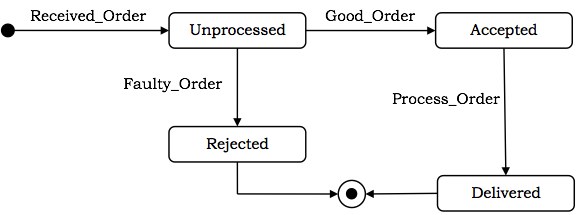
Example
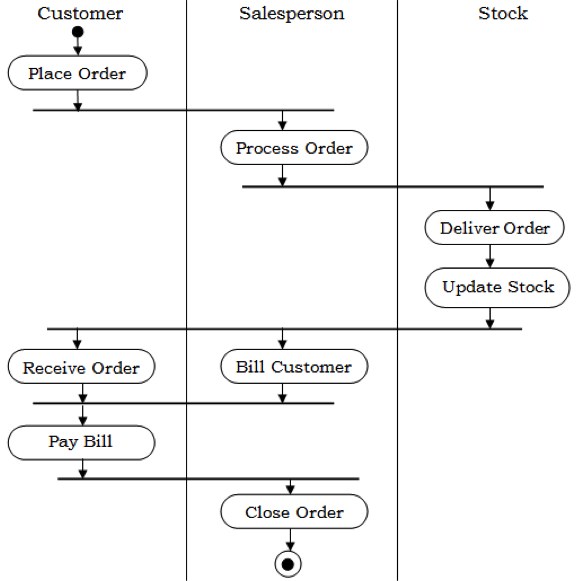
In the Automated Trading House System, let us model Order as an object and trace its sequence. The following figure shows the corresponding statechart diagram.
Activity Diagrams
An activity diagram depicts the flow of activities which are ongoing non-atomic operations in a state machine. Activities result in actions which are atomic operations.
Activity diagrams comprise of −
- Activity states and action states
- Transitions
- Objects
Activity diagrams are used for modeling −
- workflows as viewed by actors, interacting with the system.
- details of operations or computations using flowcharts.
Example
The following figure shows an activity diagram of a portion of the Automated Trading House System.
OOAD - Object Oriented Design
After the analysis phase, the conceptual model is developed further into an object-oriented model using object-oriented design (OOD). In OOD, the technology-independent concepts in the analysis model are mapped onto implementing classes, constraints are identified, and interfaces are designed, resulting in a model for the solution domain. In a nutshell, a detailed description is constructed specifyinghowthe system is to be built on concrete technologies
The stages for objectoriented design can be identified as −
- Definition of the context of the system
- Designing system architecture
- Identification of the objects in the system
- Construction of design models
- Specification of object interfaces
System Design
Object-oriented system design involves defining the context of a system followed by designing the architecture of the system.
Context − The context of a system has a static and a dynamic part. The static context of the system is designed using a simple block diagram of the whole system which is expanded into a hierarchy of subsystems. The subsystem model is represented by UML packages. The dynamic context describes how the system interacts with its environment. It is modelled using use case diagrams.
System Architecture − The system architecture is designed on the basis of the context of the system in accordance with the principles of architectural design as well as domain knowledge. Typically, a system is partitioned into layers and each layer is decomposed to form the subsystems.
Object-Oriented Decomposition
Decomposition means dividing a large complex system into a hierarchy of smaller components with lesser complexities, on the principles of divideandconquer. Each major component of the system is called a subsystem. Object-oriented decomposition identifies individual autonomous objects in a system and the communication among these objects.
The advantages of decomposition are −
The individual components are of lesser complexity, and so more understandable and manageable.
It enables division of workforce having specialized skills.
It allows subsystems to be replaced or modified without affecting other subsystems.
Identifying Concurrency
Concurrency allows more than one objects to receive events at the same time and more than one activity to be executed simultaneously. Concurrency is identified and represented in the dynamic model.
To enable concurrency, each concurrent element is assigned a separate thread of control. If the concurrency is at object level, then two concurrent objects are assigned two different threads of control. If two operations of a single object are concurrent in nature, then that object is split among different threads.
Concurrency is associated with the problems of data integrity, deadlock, and starvation. So a clear strategy needs to be made whenever concurrency is required. Besides, concurrency requires to be identified at the design stage itself, and cannot be left for implementation stage.
Identifying Patterns
While designing applications, some commonly accepted solutions are adopted for some categories of problems. These are the patterns of design. A pattern can be defined as a documented set of building blocks that can be used in certain types of application development problems.
Some commonly used design patterns are −
- Faade pattern
- Model view separation pattern
- Observer pattern
- Model view controller pattern
- Publish subscribe pattern
- Proxy pattern
Controlling Events
During system design, the events that may occur in the objects of the system need to be identified and appropriately dealt with.
An event is a specification of a significant occurrence that has a location in time and space.
There are four types of events that can be modelled, namely −
Signal Event − A named object thrown by one object and caught by another object.
Call Event − A synchronous event representing dispatch of an operation.
Time Event − An event representing passage of time.
Change Event − An event representing change in state.
Handling Boundary Conditions
The system design phase needs to address the initialization and the termination of the system as a whole as well as each subsystem. The different aspects that are documented are as follows −
The startup of the system, i.e., the transition of the system from non-initialized state to steady state.
The termination of the system, i.e., the closing of all running threads, cleaning up of resources, and the messages to be sent.
The initial configuration of the system and the reconfiguration of the system when needed.
Foreseeing failures or undesired termination of the system.
Boundary conditions are modelled using boundary use cases.
Object Design
After the hierarchy of subsystems has been developed, the objects in the system are identified and their details are designed. Here, the designer details out the strategy chosen during the system design. The emphasis shifts from application domain concepts toward computer concepts. The objects identified during analysis are etched out for implementation with an aim to minimize execution time, memory consumption, and overall cost.
Object design includes the following phases −
- Object identification
- Object representation, i.e., construction of design models
- Classification of operations
- Algorithm design
- Design of relationships
- Implementation of control for external interactions
- Package classes and associations into modules
Object Identification
The first step of object design is object identification. The objects identified in the objectoriented analysis phases are grouped into classes and refined so that they are suitable for actual implementation.
The functions of this stage are −
Identifying and refining the classes in each subsystem or package
Defining the links and associations between the classes
Designing the hierarchical associations among the classes, i.e., the generalization/specialization and inheritances
Designing aggregations
Object Representation
Once the classes are identified, they need to be represented using object modelling techniques. This stage essentially involves constructing UML diagrams.
There are two types of design models that need to be produced −
Static Models − To describe the static structure of a system using class diagrams and object diagrams.
Dynamic Models − To describe the dynamic structure of a system and show the interaction between classes using interaction diagrams and statechart diagrams.
Classification of Operations
In this step, the operation to be performed on objects are defined by combining the three models developed in the OOA phase, namely, object model, dynamic model, and functional model. An operation specifies what is to be done and not how it should be done.
The following tasks are performed regarding operations −
The state transition diagram of each object in the system is developed.
Operations are defined for the events received by the objects.
Cases in which one event triggers other events in same or different objects are identified.
The suboperations within the actions are identified.
The main actions are expanded to data flow diagrams.
Algorithm Design
The operations in the objects are defined using algorithms. An algorithm is a stepwise procedure that solves the problem laid down in an operation. Algorithms focus on how it is to be done.
There may be more than one algorithm corresponding to a given operation. Once the alternative algorithms are identified, the optimal algorithm is selected for the given problem domain. The metrics for choosing the optimal algorithm are −
Computational Complexity − Complexity determines the efficiency of an algorithm in terms of computation time and memory requirements.
Flexibility − Flexibility determines whether the chosen algorithm can be implemented suitably, without loss of appropriateness in various environments.
Understandability − This determines whether the chosen algorithm is easy to understand and implement.
Design of Relationships
The strategy to implement the relationships needs to be chalked out during the object design phase. The main relationships that are addressed comprise of associations, aggregations, and inheritances.
The designer should do the following regarding associations −
Identify whether an association is unidirectional or bidirectional.
Analyze the path of associations and update them if necessary.
Implement the associations as a distinct object, in case of manyto-many relationships; or as a link to other object in case of oneto-one or oneto-many relationships.
Regarding inheritances, the designer should do the following −
Adjust the classes and their associations.
Identify abstract classes.
Make provisions so that behaviors are shared when needed.
Implementation of Control
The object designer may incorporate refinements in the strategy of the statechart model. In system design, a basic strategy for realizing the dynamic model is made. During object design, this strategy is aptly embellished for appropriate implementation.
The approaches for implementation of the dynamic model are −
Represent State as a Location within a Program − This is the traditional procedure-driven approach whereby the location of control defines the program state. A finite state machine can be implemented as a program. A transition forms an input statement, the main control path forms the sequence of instructions, the branches form the conditions, and the backward paths form the loops or iterations.
State Machine Engine − This approach directly represents a state machine through a state machine engine class. This class executes the state machine through a set of transitions and actions provided by the application.
Control as Concurrent Tasks − In this approach, an object is implemented as a task in the programming language or the operating system. Here, an event is implemented as an inter-task call. It preserves inherent concurrency of real objects.
Packaging Classes
In any large project, meticulous partitioning of an implementation into modules or packages is important. During object design, classes and objects are grouped into packages to enable multiple groups to work cooperatively on a project.
The different aspects of packaging are −
Hiding Internal Information from Outside View − It allows a class to be viewed as a black box and permits class implementation to be changed without requiring any clients of the class to modify code.
Coherence of Elements − An element, such as a class, an operation, or a module, is coherent if it is organized on a consistent plan and all its parts are intrinsically related so that they serve a common goal.
Construction of Physical Modules − The following guidelines help while constructing physical modules −
Classes in a module should represent similar things or components in the same composite object.
Closely connected classes should be in the same module.
Unconnected or weakly connected classes should be placed in separate modules.
Modules should have good cohesion, i.e., high cooperation among its components.
A module should have low coupling with other modules, i.e., interaction or interdependence between modules should be minimum.
Design Optimization
The analysis model captures the logical information about the system, while the design model adds details to support efficient information access. Before a design is implemented, it should be optimized so as to make the implementation more efficient. The aim of optimization is to minimize the cost in terms of time, space, and other metrics.
However, design optimization should not be excess, as ease of implementation, maintainability, and extensibility are also important concerns. It is often seen that a perfectly optimized design is more efficient but less readable and reusable. So the designer must strike a balance between the two.
The various things that may be done for design optimization are −
- Add redundant associations
- Omit non-usable associations
- Optimization of algorithms
- Save derived attributes to avoid re-computation of complex expressions
Addition of Redundant Associations
During design optimization, it is checked if deriving new associations can reduce access costs. Though these redundant associations may not add any information, they may increase the efficiency of the overall model.
Omission of Non-Usable Associations
Presence of too many associations may render a system indecipherable and hence reduce the overall efficiency of the system. So, during optimization, all non-usable associations are removed.
Optimization of Algorithms
In object-oriented systems, optimization of data structure and algorithms are done in a collaborative manner. Once the class design is in place, the operations and the algorithms need to be optimized.
Optimization of algorithms is obtained by −
- Rearrangement of the order of computational tasks
- Reversal of execution order of loops from that laid down in the functional model
- Removal of dead paths within the algorithm
Saving and Storing of Derived Attributes
Derived attributes are those attributes whose values are computed as a function of other attributes (base attributes). Re-computation of the values of derived attributes every time they are needed is a timeconsuming procedure. To avoid this, the values can be computed and stored in their computed forms.
However, this may pose update anomalies, i.e., a change in the values of base attributes with no corresponding change in the values of the derived attributes. To avoid this, the following steps are taken −
With each update of the base attribute value, the derived attribute is also re-computed.
All the derived attributes are re-computed and updated periodically in a group rather than after each update.
Design Documentation
Documentation is an essential part of any software development process that records the procedure of making the software. The design decisions need to be documented for any nontrivial software system for transmitting the design to others.
Usage Areas
Though a secondary product, a good documentation is indispensable, particularly in the following areas −
- In designing software that is being developed by a number of developers
- In iterative software development strategies
- In developing subsequent versions of a software project
- For evaluating a software
- For finding conditions and areas of testing
- For maintenance of the software.
Contents
A beneficial documentation should essentially include the following contents −
Highlevel system architecture − Process diagrams and module diagrams
Key abstractions and mechanisms − Class diagrams and object diagrams.
Scenarios that illustrate the behavior of the main aspects − Behavioural diagrams
Features
The features of a good documentation are −
Concise and at the same time, unambiguous, consistent, and complete
Traceable to the systems requirement specifications
Well-structured
Diagrammatic instead of descriptive
OOAD - Implementation Strategies
Implementing an object-oriented design generally involves using a standard object oriented programming language (OOPL) or mapping object designs to databases. In most cases, it involves both.
Implementation using Programming Languages
Usually, the task of transforming an object design into code is a straightforward process. Any object-oriented programming language like C++, Java, Smalltalk, C# and Python, includes provision for representing classes. In this chapter, we exemplify the concept using C++.
The following figure shows the representation of the class Circle using C++.
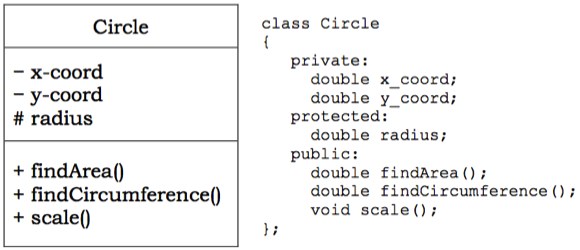
Implementing Associations
Most programming languages do not provide constructs to implement associations directly. So the task of implementing associations needs considerable thought.
Associations may be either unidirectional or bidirectional. Besides, each association may be either onetoone, onetomany, or manytomany.
Unidirectional Associations
For implementing unidirectional associations, care should be taken so that unidirectionality is maintained. The implementations for different multiplicity are as follows −
Optional Associations − Here, a link may or may not exist between the participating objects. For example, in the association between Customer and Current Account in the figure below, a customer may or may not have a current account.

For implementation, an object of Current Account is included as an attribute in Customer that may be NULL. Implementation using C++ −
class Customer {
   private:
   // attributes
   Current_Account c; //an object of Current_Account as attribute

   public:

   Customer() {
      c = NULL;
   } // assign c as NULL

   Current_Account getCurrAc() {
      return c;
   }

   void setCurrAc( Current_Account myacc) {
      c = myacc;
   }

   void removeAcc() {
      c = NULL;
   }
};
Onetoone Associations − Here, one instance of a class is related to exactly one instance of the associated class. For example, Department and Manager have onetoone association as shown in the figure below.

This is implemented by including in Department, an object of Manager that should not be NULL. Implementation using C++ −
class Department {
   private:
   // attributes
   Manager mgr; //an object of Manager as attribute

   public:
   Department (/*parameters*/, Manager m) { //m is not NULL
      // assign parameters to variables
      mgr = m;
   }

   Manager getMgr() {
      return mgr;
   }
};
Onetomany Associations − Here, one instance of a class is related to more than one instances of the associated class. For example, consider the association between Employee and Dependent in the following figure.

This is implemented by including a list of Dependents in class Employee. Implementation using C++ STL list container −
class Employee {
   private:
   char * deptName;
   list <Dependent> dep; //a list of Dependents as attribute

   public:
   void addDependent ( Dependent d) {
      dep.push_back(d);
   } // adds an employee to the department

   void removeDeoendent( Dependent d) {
      int index = find ( d, dep );
      // find() function returns the index of d in list dep
      dep.erase(index);
   }
};
Bi-directional Associations
To implement bi-directional association, links in both directions require to be maintained.
Optional or onetoone Associations − Consider the relationship between Project and Project Manager having onetoone bidirectional association as shown in the figure below.

Implementation using C++ −
Class Project {
   private:
   // attributes
   Project_Manager pmgr;
   public:
   void setManager ( Project_Manager pm);
   Project_Manager changeManager();
};

class Project_Manager {
   private:
   // attributes
   Project pj;

   public:
   void setProject(Project p);
   Project removeProject();
};
Onetomany Associations − Consider the relationship between Department and Employee having onetomany association as shown in the figure below.

Implementation using C++ STL list container
class Department {
   private:
   char * deptName;
   list <Employee> emp; //a list of Employees as attribute

   public:
   void addEmployee ( Employee e) {
      emp.push_back(e);
   } // adds an employee to the department

   void removeEmployee( Employee e) {
      int index = find ( e, emp );
      // find function returns the index of e in list emp
      emp.erase(index);
   }
};

class Employee {
   private:
   //attributes
   Department d;

   public:
   void addDept();
   void removeDept();
};
Implementing Associations as Classes
If an association has some attributes associated, it should be implemented using a separate class. For example, consider the onetoone association between Employee and Project as shown in the figure below.
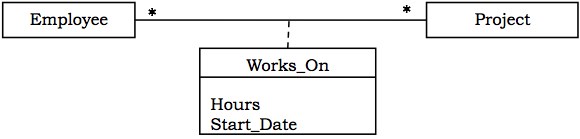
Implementation of WorksOn using C++
class WorksOn {
   private:
   Employee e;
   Project p;
   Hours h;
   char * date;

   public:
   // class methods
};
Implementing Constraints
Constraints in classes restrict the range and type of values that the attributes may take. In order to implement constraints, a valid default value is assigned to the attribute when an object is instantiated from the class. Whenever the value is changed at runtime, it is checked whether the value is valid or not. An invalid value may be handled by an exception handling routine or other methods.
Example
Consider an Employee class where age is an attribute that may have values in the range of 18 to 60. The following C++ code incorporates it −
class Employee {
   private: char * name;
   int age;
   // other attributes

   public:
   Employee() {                 // default constructor
      strcpy(name, "");
      age = 18;                // default value
   }

   class AgeError {};          // Exception class
   void changeAge( int a) {    // method that changes age

      if ( a < 18 || a > 60 )  // check for invalid condition
      throw AgeError();        // throw exception
      age = a;
   }
};
Implementing State Charts
There are two alternative implementation strategies to implement states in state chart diagrams.
Enumerations within Class
In this approach, the states are represented by different values of a data member (or set of data members). The values are explicitly defined by an enumeration within the class. The transitions are represented by member functions that change the value of the concerned data member.
Arrangement of Classes in a Generalization Hierarchy
In this approach, the states are arranged in a generalization hierarchy in a manner that they can be referred by a common pointer variable. The following figure shows a transformation from state chart diagram to a generalization hierarchy.
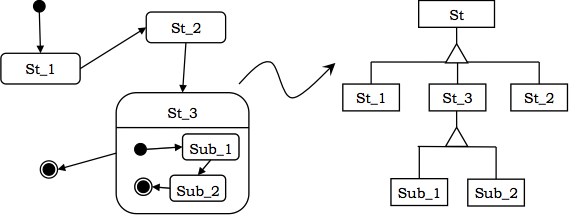
Object Mapping to Database System
Persistency of Objects
An important aspect of developing object-oriented systems is persistency of data. Through persistency, objects have longer lifespan than the program that created it. Persistent data is saved on secondary storage medium from where it can be reloaded when required.
Overview of RDBMS
A database is an ordered collection of related data.
A database management system (DBMS) is a collection of software that facilitates the processes of defining, creating, storing, manipulating, retrieving, sharing, and removing data in databases.
In relational database management systems (RDBMS), data is stored as relations or tables, where each column or field represents an attribute and each row or tuple represents a record of an instance.
Each row is uniquely identified by a chosen set of minimal attributes called primary key.
A foreign key is an attribute that is the primary key of a related table.
Representing Classes as Tables in RDBMS
To map a class to a database table, each attribute is represented as a field in the table. Either an existing attribute(s) is assigned as a primary key or a separate ID field is added as a primary key. The class may be partitioned horizontally or vertically as per requirement.
For example, the Circle class can be converted to table as shown in the figure below.
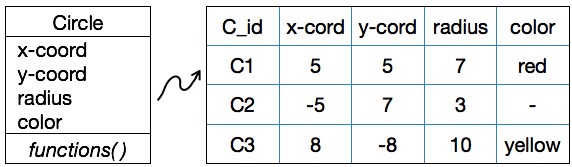
Schema for Circle Table: CIRCLE(CID, X_COORD, Y_COORD, RADIUS, COLOR)
Creating a Table Circle using SQL command:
CREATE TABLE CIRCLE (
   CID	VARCHAR2(4) PRIMARY KEY,
   X_COORD INTEGER NOT NULL,
   Y_COORD INTEGER NOT NULL,
   Z_COORD INTEGER NOT NULL,
   COLOR
);
Mapping Associations to Database Tables
OnetoOne Associations
To implement 1:1 associations, the primary key of any one table is assigned as the foreign key of the other table. For example, consider the association between Department and Manager −
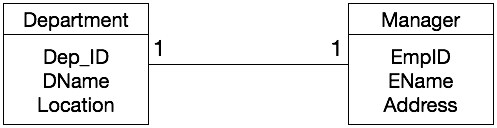
SQL commands to create the tables
CREATE TABLE DEPARTMENT (
   DEPT_ID INTEGER PRIMARY KEY,
   DNAME VARCHAR2(30) NOT NULL,
   LOCATION VARCHAR2(20),
   EMPID INTEGER REFERENCES MANAGER
);

CREATE TABLE MANAGER (
   EMPID INTEGER PRIMARY KEY,
   ENAME VARCHAR2(50) NOT NULL,
   ADDRESS VARCHAR2(70),
);
OnetoMany Associations
To implement 1:N associations, the primary key of the table in the 1-side of the association is assigned as the foreign key of the table at the N-side of the association. For example, consider the association between Department and Employee −
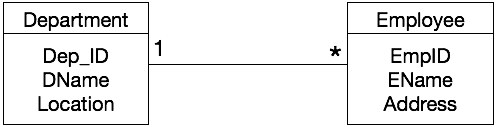
SQL commands to create the tables
CREATE TABLE DEPARTMENT (
   DEPT_ID INTEGER PRIMARY KEY,
   DNAME VARCHAR2(30) NOT NULL,
   LOCATION VARCHAR2(20),
);

CREATE TABLE EMPLOYEE (
   EMPID INTEGER PRIMARY KEY,
   ENAME VARCHAR2(50) NOT NULL,
   ADDRESS VARCHAR2(70),
   D_ID INTEGER REFERENCES DEPARTMENT
);
ManytoMany Associations
To implement M:N associations, a new relation is created that represents the association. For example, consider the following association between Employee and Project −
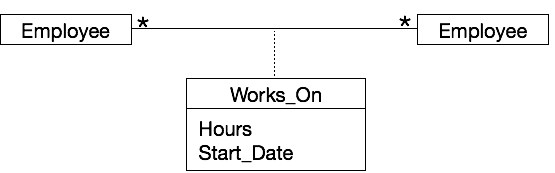
Schema for Works_On Table − WORKS_ON (EMPID, PID, HOURS, START_DATE)
SQL command to create Works_On association − CREATE TABLE WORKS_ON
(
   EMPID INTEGER,
   PID INTEGER,
   HOURS INTEGER,
   START_DATE DATE,
   PRIMARY KEY (EMPID, PID),
   FOREIGN KEY (EMPID) REFERENCES EMPLOYEE,
   FOREIGN KEY (PID) REFERENCES PROJECT
);
Mapping Inheritance to Tables
To map inheritance, the primary key of the base table(s) is assigned as the primary key as well as the foreign key in the derived table(s).
Example
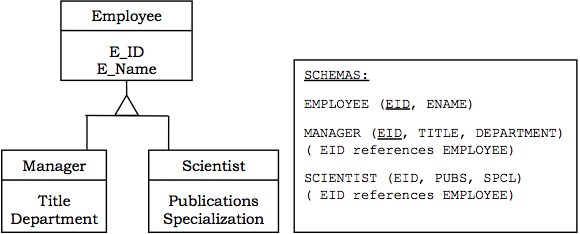
OOAD - Testing & Quality Assurance
Once a program code is written, it must be tested to detect and subsequently handle all errors in it. A number of schemes are used for testing purposes.
Another important aspect is the fitness of purpose of a program that ascertains whether the program serves the purpose which it aims for. The fitness defines the software quality.
Testing Object-Oriented Systems
Testing is a continuous activity during software development. In object-oriented systems, testing encompasses three levels, namely, unit testing, subsystem testing, and system testing.
Unit Testing
In unit testing, the individual classes are tested. It is seen whether the class attributes are implemented as per design and whether the methods and the interfaces are error-free. Unit testing is the responsibility of the application engineer who implements the structure.
Subsystem Testing
This involves testing a particular module or a subsystem and is the responsibility of the subsystem lead. It involves testing the associations within the subsystem as well as the interaction of the subsystem with the outside. Subsystem tests can be used as regression tests for each newly released version of the subsystem.
System Testing
System testing involves testing the system as a whole and is the responsibility of the quality-assurance team. The team often uses system tests as regression tests when assembling new releases.
Object-Oriented Testing Techniques
Grey Box Testing
The different types of test cases that can be designed for testing object-oriented programs are called grey box test cases. Some of the important types of grey box testing are −
State model based testing − This encompasses state coverage, state transition coverage, and state transition path coverage.
Use case based testing − Each scenario in each use case is tested.
Class diagram based testing − Each class, derived class, associations, and aggregations are tested.
Sequence diagram based testing − The methods in the messages in the sequence diagrams are tested.
Techniques for Subsystem Testing
The two main approaches of subsystem testing are −
Thread based testing − All classes that are needed to realize a single use case in a subsystem are integrated and tested.
Use based testing − The interfaces and services of the modules at each level of hierarchy are tested. Testing starts from the individual classes to the small modules comprising of classes, gradually to larger modules, and finally all the major subsystems.
Categories of System Testing
Alpha testing − This is carried out by the testing team within the organization that develops software.
Beta testing − This is carried out by select group of co-operating customers.
Acceptance testing − This is carried out by the customer before accepting the deliverables.
Software Quality Assurance
Software Quality
Schulmeyer and McManus have defined software quality as the fitness for use of the total software product. A good quality software does exactly what it is supposed to do and is interpreted in terms of satisfaction of the requirement specification laid down by the user.
Quality Assurance
Software quality assurance is a methodology that determines the extent to which a software product is fit for use. The activities that are included for determining software quality are −
- Auditing
- Development of standards and guidelines
- Production of reports
- Review of quality system
Quality Factors
Correctness − Correctness determines whether the software requirements are appropriately met.
Usability − Usability determines whether the software can be used by different categories of users (beginners, non-technical, and experts).
Portability − Portability determines whether the software can operate in different platforms with different hardware devices.
Maintainability − Maintainability determines the ease at which errors can be corrected and modules can be updated.
Reusability − Reusability determines whether the modules and classes can be reused for developing other software products.
Object-Oriented Metrics
Metrics can be broadly classified into three categories: project metrics, product metrics, and process metrics.
Project Metrics
Project Metrics enable a software project manager to assess the status and performance of an ongoing project. The following metrics are appropriate for object-oriented software projects −
- Number of scenario scripts
- Number of key classes
- Number of support classes
- Number of subsystems
Product Metrics
Product metrics measure the characteristics of the software product that has been developed. The product metrics suitable for object-oriented systems are −
Methods per Class − It determines the complexity of a class. If all the methods of a class are assumed to be equally complex, then a class with more methods is more complex and thus more susceptible to errors.
Inheritance Structure − Systems with several small inheritance lattices are more wellstructured than systems with a single large inheritance lattice. As a thumb rule, an inheritance tree should not have more than 7 ( 2) number of levels and the tree should be balanced.
Coupling and Cohesion − Modules having low coupling and high cohesion are considered to be better designed, as they permit greater reusability and maintainability.
Response for a Class − It measures the efficiency of the methods that are called by the instances of the class.
Process Metrics
Process metrics help in measuring how a process is performing. They are collected over all projects over long periods of time. They are used as indicators for long-term software process improvements. Some process metrics are −
- Number of KLOC (Kilo Lines of Code)
- Defect removal efficiency
- Average number of failures detected during testing
- Number of latent defects per KLOC
