- OOAD - Home
- OOAD - Object Oriented Paradigm
- OOAD - Object Oriented Model
- OOAD - Object Oriented System
- OOAD - Object Oriented Principles
- OOAD - Object Oriented Analysis
- OOAD - Dynamic Modelling
- OOAD - Functional Modelling
- OOAD - UML Analysis Model
- OOAD - UML Basic Notations
- OOAD - UML Structural Diagrams
- OOAD - UML Behavioural Diagrams
- OOAD - Object Oriented Design
- OOAD - Implementation Strategies
- OOAD - Testing & Quality Assurance
OOAD - UML Behavioural Diagrams
UML behavioral diagrams visualize, specify, construct, and document the dynamic aspects of a system. The behavioral diagrams are categorized as follows: use case diagrams, interaction diagrams, statechart diagrams, and activity diagrams.
Use Case Model
Use case
A use case describes the sequence of actions a system performs yielding visible results. It shows the interaction of things outside the system with the system itself. Use cases may be applied to the whole system as well as a part of the system.
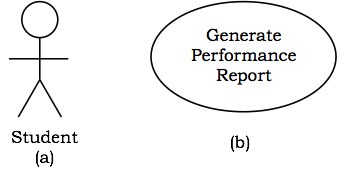
Actor
An actor represents the roles that the users of the use cases play. An actor may be a person (e.g. student, customer), a device (e.g. workstation), or another system (e.g. bank, institution).
The following figure shows the notations of an actor named Student and a use case called Generate Performance Report.
Use case diagrams
Use case diagrams present an outside view of the manner the elements in a system behave and how they can be used in the context.
Use case diagrams comprise of −
- Use cases
- Actors
- Relationships like dependency, generalization, and association
Use case diagrams are used −
To model the context of a system by enclosing all the activities of a system within a rectangle and focusing on the actors outside the system by interacting with it.
To model the requirements of a system from the outside point of view.
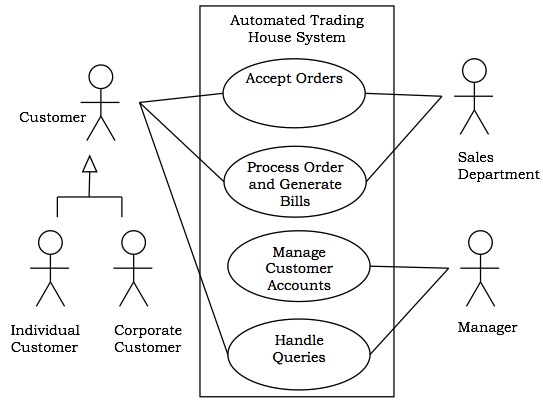
Example
Let us consider an Automated Trading House System. We assume the following features of the system −
The trading house has transactions with two types of customers, individual customers and corporate customers.
Once the customer places an order, it is processed by the sales department and the customer is given the bill.
The system allows the manager to manage customer accounts and answer any queries posted by the customer.
Interaction Diagrams
Interaction diagrams depict interactions of objects and their relationships. They also include the messages passed between them. There are two types of interaction diagrams −
- Sequence Diagrams
- Collaboration Diagrams
Interaction diagrams are used for modeling −
the control flow by time ordering using sequence diagrams.
the control flow of organization using collaboration diagrams.
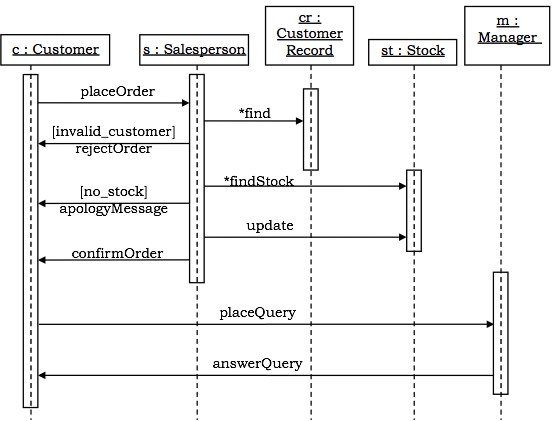
Sequence Diagrams
Sequence diagrams are interaction diagrams that illustrate the ordering of messages according to time.
Notations − These diagrams are in the form of two-dimensional charts. The objects that initiate the interaction are placed on the xaxis. The messages that these objects send and receive are placed along the yaxis, in the order of increasing time from top to bottom.
Example − A sequence diagram for the Automated Trading House System is shown in the following figure.
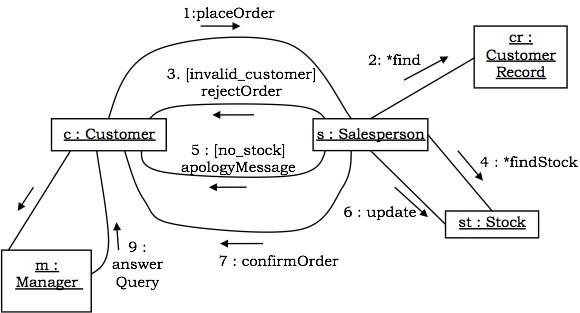
Collaboration Diagrams
Collaboration diagrams are interaction diagrams that illustrate the structure of the objects that send and receive messages.
Notations − In these diagrams, the objects that participate in the interaction are shown using vertices. The links that connect the objects are used to send and receive messages. The message is shown as a labeled arrow.
Example − Collaboration diagram for the Automated Trading House System is illustrated in the figure below.
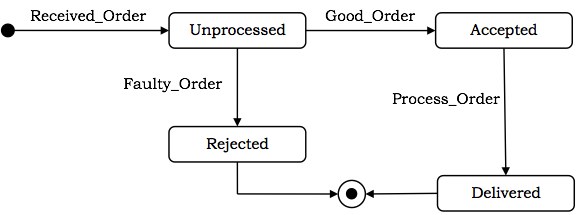
StateChart Diagrams
A statechart diagram shows a state machine that depicts the control flow of an object from one state to another. A state machine portrays the sequences of states which an object undergoes due to events and their responses to events.
StateChart Diagrams comprise of −
- States: Simple or Composite
- Transitions between states
- Events causing transitions
- Actions due to the events
State-chart diagrams are used for modeling objects which are reactive in nature.
Example
In the Automated Trading House System, let us model Order as an object and trace its sequence. The following figure shows the corresponding statechart diagram.
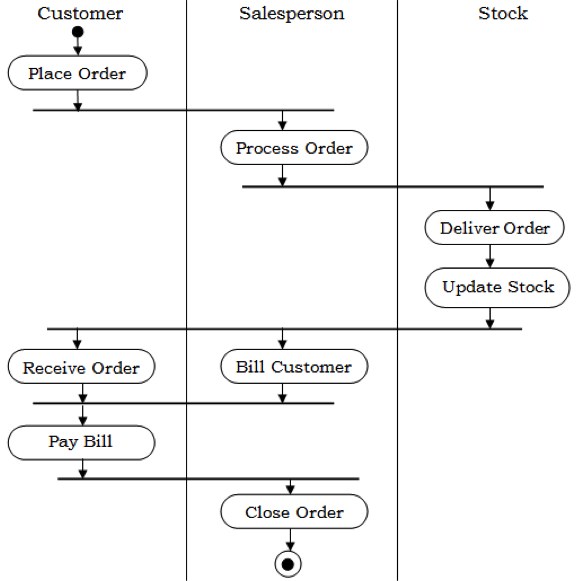
Activity Diagrams
An activity diagram depicts the flow of activities which are ongoing non-atomic operations in a state machine. Activities result in actions which are atomic operations.
Activity diagrams comprise of −
- Activity states and action states
- Transitions
- Objects
Activity diagrams are used for modeling −
- workflows as viewed by actors, interacting with the system.
- details of operations or computations using flowcharts.
Example
The following figure shows an activity diagram of a portion of the Automated Trading House System.