
Article Categories
- All Categories
-
 Data Structure
-
 Networking
-
 RDBMS
RDBMS
-
 Operating System
-
 Java
Java
-
 MS Excel
-
 iOS
iOS
-
 HTML
HTML
-
 CSS
CSS
-
 Android
-
 Python
-
 C Programming
-
 C++
C++
-
 C#
C#
-
 MongoDB
-
 MySQL
MySQL
-
 Javascript
-
 PHP
PHP
-
 Economics & Finance
Selected Reading
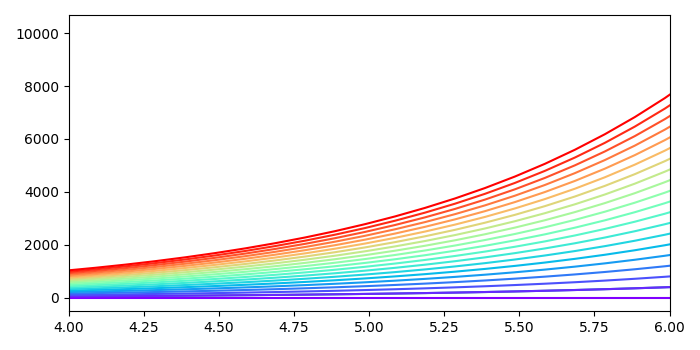
Matplotlib Plot Lines with Colors through Colormap
To plot lines with colors through colormap, we can take the following steps−
- Create x and y data points using numpy
- Plot x and y data points using plot() method.
- Count n finds, number of color lines has to be plotted.
- Iterate in a range (n) and plot the lines.
- Limit the x ticks range.
- Use show() method to display the figure.
Example
import numpy as np
import matplotlib.pylab as plt
plt.rcParams["figure.figsize"] = [7.00, 3.50]
plt.rcParams["figure.autolayout"] = True
x = np.linspace(0, 2 * np.pi, 64)
y = np.exp(x)
plt.plot(x, y)
n = 20
colors = plt.cm.rainbow(np.linspace(0, 1, n))
for i in range(n):
plt.plot(x, i * y, color=colors[i])
plt.xlim(4, 6)
plt.show()
Output

Updated on: 2021-05-06T13:02:02+05:30
14K+ Views

Advertisements