- ML - Home
- ML - Introduction
- ML - Getting Started
- ML - Basic Concepts
- ML - Ecosystem
- ML - Python Libraries
- ML - Applications
- ML - Life Cycle
- ML - Required Skills
- ML - Implementation
- ML - Challenges & Common Issues
- ML - Limitations
- ML - Reallife Examples
- ML - Data Structure
- ML - Mathematics
- ML - Artificial Intelligence
- ML - Neural Networks
- ML - Deep Learning
- ML - Getting Datasets
- ML - Categorical Data
- ML - Data Loading
- ML - Data Understanding
- ML - Data Preparation
- ML - Models
- ML - Supervised Learning
- ML - Unsupervised Learning
- ML - Semi-supervised Learning
- ML - Reinforcement Learning
- ML - Supervised vs. Unsupervised
- Machine Learning Data Visualization
- ML - Data Visualization
- ML - Histograms
- ML - Density Plots
- ML - Box and Whisker Plots
- ML - Correlation Matrix Plots
- ML - Scatter Matrix Plots
- Statistics for Machine Learning
- ML - Statistics
- ML - Mean, Median, Mode
- ML - Standard Deviation
- ML - Percentiles
- ML - Data Distribution
- ML - Skewness and Kurtosis
- ML - Bias and Variance
- ML - Hypothesis
- Regression Analysis In ML
- ML - Regression Analysis
- ML - Linear Regression
- ML - Simple Linear Regression
- ML - Multiple Linear Regression
- ML - Polynomial Regression
- Classification Algorithms In ML
- ML - Classification Algorithms
- ML - Logistic Regression
- ML - K-Nearest Neighbors (KNN)
- ML - Naïve Bayes Algorithm
- ML - Decision Tree Algorithm
- ML - Support Vector Machine
- ML - Random Forest
- ML - Confusion Matrix
- ML - Stochastic Gradient Descent
- Clustering Algorithms In ML
- ML - Clustering Algorithms
- ML - Centroid-Based Clustering
- ML - K-Means Clustering
- ML - K-Medoids Clustering
- ML - Mean-Shift Clustering
- ML - Hierarchical Clustering
- ML - Density-Based Clustering
- ML - DBSCAN Clustering
- ML - OPTICS Clustering
- ML - HDBSCAN Clustering
- ML - BIRCH Clustering
- ML - Affinity Propagation
- ML - Distribution-Based Clustering
- ML - Agglomerative Clustering
- Dimensionality Reduction In ML
- ML - Dimensionality Reduction
- ML - Feature Selection
- ML - Feature Extraction
- ML - Backward Elimination
- ML - Forward Feature Construction
- ML - High Correlation Filter
- ML - Low Variance Filter
- ML - Missing Values Ratio
- ML - Principal Component Analysis
- Reinforcement Learning
- ML - Reinforcement Learning Algorithms
- ML - Exploitation & Exploration
- ML - Q-Learning
- ML - REINFORCE Algorithm
- ML - SARSA Reinforcement Learning
- ML - Actor-critic Method
- ML - Monte Carlo Methods
- ML - Temporal Difference
- Deep Reinforcement Learning
- ML - Deep Reinforcement Learning
- ML - Deep Reinforcement Learning Algorithms
- ML - Deep Q-Networks
- ML - Deep Deterministic Policy Gradient
- ML - Trust Region Methods
- Quantum Machine Learning
- ML - Quantum Machine Learning
- ML - Quantum Machine Learning with Python
- Machine Learning Miscellaneous
- ML - Performance Metrics
- ML - Automatic Workflows
- ML - Boost Model Performance
- ML - Gradient Boosting
- ML - Bootstrap Aggregation (Bagging)
- ML - Cross Validation
- ML - AUC-ROC Curve
- ML - Grid Search
- ML - Data Scaling
- ML - Train and Test
- ML - Association Rules
- ML - Apriori Algorithm
- ML - Gaussian Discriminant Analysis
- ML - Cost Function
- ML - Bayes Theorem
- ML - Precision and Recall
- ML - Adversarial
- ML - Stacking
- ML - Epoch
- ML - Perceptron
- ML - Regularization
- ML - Overfitting
- ML - P-value
- ML - Entropy
- ML - MLOps
- ML - Data Leakage
- ML - Monetizing Machine Learning
- ML - Types of Data
- Machine Learning - Resources
- ML - Quick Guide
- ML - Cheatsheet
- ML - Interview Questions
- ML - Useful Resources
- ML - Discussion
Supervised Machine Learning
What is Supervised Machine Learning?
Supervised learning, also known as supervised machine learning, is a type of machine learning that trains the model using labeled datasets to predict outcomes. A Labeled dataset is one that consists of input data (features) along with corresponding output data (targets).
The main objective of supervised learning algorithms is to learn an association between input data samples and corresponding outputs after performing multiple training data instances.
How does Supervised Learning Work?
In supervised machine learning, models are trained using a dataset that consists of input-output pairs.
The supervised learning algorithm analyzes the dataset and learns the relation between the input data (features) and correct output (labels/ targets). In the process of training, the model estimates the algorithm's parameters by minimizing a loss function. The loss function measures the difference between the model's predictions and actual target values.
The model iteratively updates its parameters until the loss/ error has been sufficiently minimized.
Once the training is completed, the model parameters have optimal values. The model has learned the optimal mapping/ relation between the inputs and targets. Now, the model can predict values for the new and unseen input data.
Types of Supervised Learning Algorithm
Supervised machine learning is categorized into two types of problems − classification and regression.
1. Classification
The key objective of classification-based tasks is to predict categorical output labels or responses for the given input data such as true-false, male-female, yes-no etc. As we know, the categorical output responses mean unordered and discrete values; hence, each output response will belong to a specific class or category.
Some popular classification algorithms are decision trees, random forests, support vector machines (SVM), logistic regression, etc.
2. Regression
The key objective of regression-based tasks is to predict output labels or responses, which are continuous numeric values, for the given input data. Basically, regression models use the input data features (independent variables) and their corresponding continuous numeric output values (dependent or outcome variables) to learn specific associations between inputs and corresponding outputs.
Some popular regression algorithms are linear regression, polynomial regression, Laso regression, etc.
Algorithms for Supervised Learning
Supervised learning is one of the important models of learning involved in training machines. This chapter talks in detail about the same.
There are several algorithms available for supervised learning. Some of the widely used algorithms of supervised learning are as shown below −
- Linear Regression
- k-Nearest Neighbors
- Decision Trees
- Naive Bayes
- Logistic Regression
- Support Vector Machines
- Random Forest
- Gradient Boosting
Let's discuss each of the above mentioned supervised machine learning algorithms in detail.
1. Linear Regression
Linear regression is a type of algorithm that tries to find the linear relation between input features and output values for the prediction of future events. This algorithm is widely used to perform stock analysis, weather forecasting and others.
2. K-Nearest Neighbors
The k-Nearest Neighbors (kNN) is a statistical technique that can be used for solving classification and regression problems. This algorithm classifies or predicts values for new data by mathematically calculating the nearest distance with other points in training data.
Let us discuss the case of classifying an unknown object using kNN. Consider the distribution of objects as shown in the image given below −

Source:
https://en.wikipedia.org/wiki/K-nearest_neighbors_algorithm
The diagram shows three types of objects, marked in red, blue and green colors. When you run the kNN classifier on the above dataset, the boundaries for each type of object will be marked as shown below −

Source:
https://en.wikipedia.org/wiki/K-nearest_neighbors_algorithm
Now, consider a new unknown object you want to classify as red, green or blue. This is depicted in the figure below.

As you see it visually, the unknown data point belongs to a class of blue objects. Mathematically, this can be concluded by measuring the distance of this unknown point with every other point in the data set. When you do so, you will know that most of its neighbors are blue in color. The average distance between red and green objects would definitely be more than the average distance between blue objects. Thus, this unknown object can be classified as belonging to blue class.
The kNN algorithm can also be used for regression problems. The kNN algorithm is available as ready-to-use in most of the ML libraries.
3. Decision Trees
A Decision tree is a tree-like structure used to make decisions and analyze the possible consequences. The algorithm splits the data into subsets based on features, where each parent node represents internal decisions and the leaf node represents final prediction.
A simple decision tree in a flowchart format is shown below −

You would write a code to classify your input data based on this flowchart. The flowchart is self-explanatory and trivial. In this scenario, you are trying to classify an incoming email to decide when to read it.
In reality, the decision trees can be large and complex. There are several algorithms available to create and traverse these trees. As a Machine Learning enthusiast, you need to understand and master these techniques of creating and traversing decision trees.
4. Naive Bayes
Naive Bayes is used for creating classifiers. Suppose you want to sort out (classify) fruits of different kinds from a fruit basket. You may use features such as color, size, and shape of fruit; for example, any fruit that is red in color, round in shape, and about 10 cm in diameter may be considered an Apple. So to train the model, you would use these features and test the probability that a given feature matches the desired constraints. The probabilities of different features are then combined to arrive at the probability that a given fruit is an Apple. Naive Bayes generally requires a small number of training data for classification.
5. Logistic Regression
Logistic regression is a type of statistical algorithm that estimates the probability of occurrence of an event.
Look at the following diagram. It shows the distribution of data points in the XY plane.

From the diagram, we can visually inspect the separation of red and green dots. You may draw a boundary line to separate out these dots. Now, to classify a new data point, you will just need to determine on which side of the line the point lies.
6. Support Vector Machines
Support Vector Machines (SVM) algorithm can be typically used for both classification and regression. For classification tasks, the algorithm creates a hyperplane to separate data into classes. While for regression, the algorithm tries to fit a regression line with minimal error.
Look at the following distribution of data. Here the three classes of data cannot be linearly separated. The boundary curves are non-linear. In such a case, finding the curve's equation becomes a complex job.
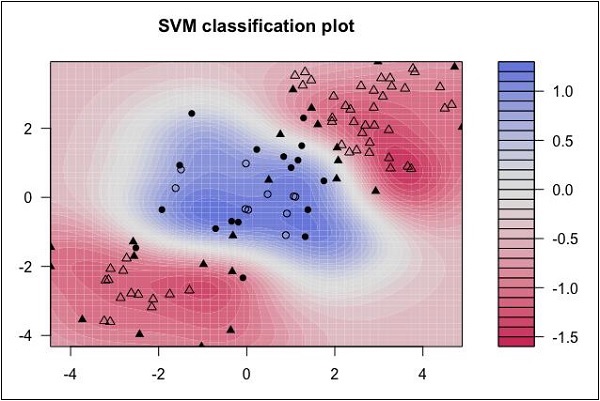
Source: http://uc-r.github.io/svm
The Support Vector Machines (SVM) come in handy in determining the separation boundaries in such situations.
7. Random Forest
Random forest is also a supervised learning algorithm that is flexible for classification and regression. This algorithm is a combination of multiple decision trees which are merged to improve the accuracy of prediction .
The following diagram illustrates how the Random Forest Algorithm works −

8. Gradient Boosting
Gradient boosting combines weak learners(decision trees), to create a strong model. It builds new models that correct errors of the previous ones. The goal of this algorithm is to minimize the loss function. It can be efficiently used for classification and regression tasks.
Advantages of Supervised Learning
Supervised learning algorithms are one of the most popular among the machine learning models. Some benefits are:-
- The goal in supervised learning is well-defined, which improves the prediction accuracy.
- Models trained using supervised learning are effective at predicting and classification since they use labeled datasets.
- It can be highly versatile, i.e., applied to various problems, like spam detection, stock prices, etc.
Disadvantages of Supervised Learning
Though supervised learning is the most used, it comes with certain challenges too. Some of them are:
- Supervised learning requires a large amount of labeled data for the model to train effectively. It is practically very difficult to collect such huge data; it is expensive and time-consuming.
- Supervised learning cannot predict accurately if the test data is different from the training data.
- Accurately labeling the data is complex and requires expertise and effort.
Applications of Supervised learning
Supervised learning models are widely used in many applications in various sectors, including the following-
- Image recognition − A model is trained on a labeled dataset of images, where each image is associated with a label. The model is fed with data, which allows it to learn patterns and features. Once trained, the model can now be tested using new, unseen data. This is widely used in applications like facial recognition and object detection.
- Predictive analytics − Supervised learning algorithms are used to train labeled historical data, allowing the model to learn patterns and relations between input features and output to identify trends and make accurate predictions. Businesses use this method to make data-driven decisions and enhance strategic planning.
