
Article Categories
- All Categories
-
 Data Structure
-
 Networking
-
 RDBMS
RDBMS
-
 Operating System
-
 Java
Java
-
 MS Excel
-
 iOS
iOS
-
 HTML
HTML
-
 CSS
CSS
-
 Android
-
 Python
-
 C Programming
-
 C++
C++
-
 C#
C#
-
 MongoDB
-
 MySQL
MySQL
-
 Javascript
-
 PHP
PHP
-
 Economics & Finance
How to Use Tex (LaTeX Math Mode) Symbols in Legends and Labels in MATLAB Figures?
MATLAB is a powerful tool to perform various mathematical tasks such as performing operations, plotting charts and figures, manipulating matrices, and more. In digital mathematical tools like MATLAB, there is a typesetting system called "TeX" which is used to communicate and publish mathematical equations and structures. This typesetting system was developed by Donald Knuth. In this tutorial, I will explain the TeX system in LaTeX math mode and the use of TeX symbols in legends and labels in a plot or figure in MATLAB.
What is TeX in MATLAB?
TeX is a typesetting system used to publish mathematical equations and structures in mathematical tools. This system was developed by a compute scientist Donald Knuth.
In MATLAB, the TeX and its derivative LaTeX are used for rendering and displaying mathematical equations, symbols, structures, etc. in plots, figures, legends, labels, etc. This typesetting system tells the MATLAB compiler to handle the mathematical symbols and structures properly.
Let us now discuss the use of TeX symbols in MATLAB figures.
How to Use TeX Symbols in MATLAB?
In MATLAB, we have two options namely, "Interpreter" and "latex". These two options are used to render and display the TeX symbols in MATLAB figures.
The "Interpreter" option with the "latex" property enables the TeX interpreter to render the TeX symbols in the MATLAB figure.
In MATLAB, the mathematical expressions or TeX symbols should be enclosed in dollar signs "$...$" to specify them as LaTeX math elements. Basically, the "$...$" indicates the LaTeX math mode in MATLAB programming.
How to Use TeX Symbols in Legends in MATLAB Figure?
In MATLAB, we can use the TeX symbols in legends in a MATLAB figure. For this, we use the "Interpreter" and "latex" options in the "legend" function.
Example
The following example demonstrates the use of TeX symbols in legends in a MATLAB figure.
% MATLAB code to use TeX symbols in legends
% Create sample data
theta = linspace(0, 2*pi, 200);
y1 = sin(theta);
y2 = cos(theta);

% Plot the data
figure;
plot(theta, y1, 'r');
hold on;
plot(theta, y2, 'b');

% Add legend with LaTeX symbols
legend('$\sin(\theta)$', '$\cos(\theta)$', 'Interpreter', 'latex');

% Hold off to disable further plotting
hold off;
Output
It will produce the following output

Explanation
In this example, we start by create a sample plot for sine and cosine functions. Then, we add a legend with LaTeX symbols i.e., "$\sin(\theta)$" and "$\cos(\theta)$". Here the strings enclosed in "$...$" signs are interpreted as TeX symbols. Also, the "Interpreter" and "latex" options are used to enable the LaTeX math mode for the "legend" function.
How to Use TeX Symbols in Labels in MATLAB Figure?
In MATLAB, we can also use the TeX symbols in labels in a figure. For this, we have to enable the LaTeX interpreter for the label (xlabel and ylabel) functions.
Example
Here is an example showing the use of TeX symbols in labels in a MATLAB figure.
% MATLAB code to use TeX symbols in labels
% Create sample data
theta = linspace(0, 2*pi, 200);
y = sin(theta);

% Plot the data
figure;
plot(theta, y, 'r');

% Add labels with TeX symbols to the figure
xlabel('Angle $(\theta)$', 'Interpreter', 'latex');
ylabel('Magnitude $(y)$', 'Interpreter', 'latex');
Output
It will produce the following output
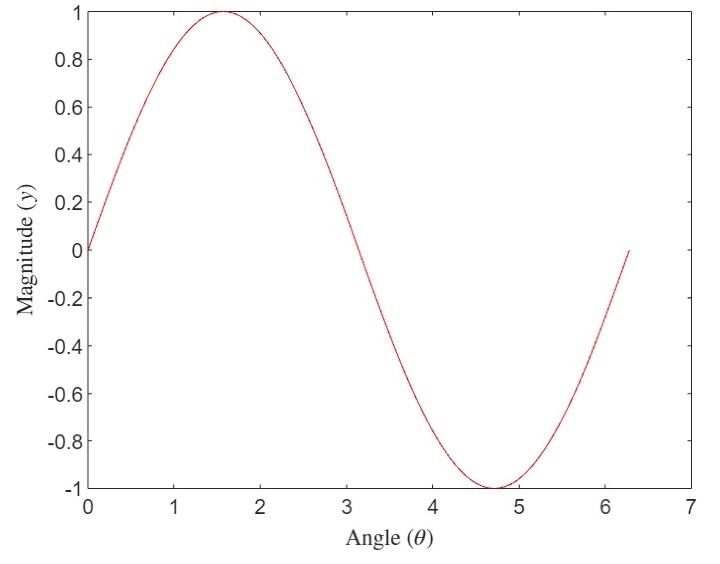
Explanation
In this example, we plot a figure for sample data and sine function. Then, we add labels to the x-axis and y-axis using the "xlabel" and "ylabel" functions. In these functions, we specify the LaTeX symbols within "$...$" signs and use the "Interpreter" and "latex" options to enable the LaTeX math mode to interpret these symbols.
Conclusion
This is all about TeX symbols and their use in lagend and labels in MATLAB figures. In this article, I explained the use of TeX symbols with LaTeX math mode with the help of examples in MATLAB.

501 Views
