 Data Structure
 Networking
 RDBMS
RDBMS Operating System
 Java
Java MS Excel
 iOS
iOS HTML
HTML CSS
CSS Android
 Python
 C Programming
 C++
C++ C#
C# MongoDB
 MySQL
MySQL Javascript
 PHP
PHP
- Selected Reading
- UPSC IAS Exams Notes
- Developer's Best Practices
- Questions and Answers
- Effective Resume Writing
- HR Interview Questions
- Computer Glossary
- Who is Who
Contour Plot using Python Matplotlib
Matplotlib is free and open-source plotting library in python. It is used to create 2-Dimensional graphs and plots by using python scripts. To utilize the matplotlib functionalities we need to install the library first.
Install using pip
By execute the below command in the command prompt we can easily install the latest stable package for Matplotlib from PyPi.
pip install Matplotlib
You can install Matplotlib through conda, using the following command -
conda install -c conda-forge matplotlib
A Contour plot is used for visualizing three-dimensional data in a two-dimensional surface by plotting constant z slices, called contours.
It is drawn with the help of a contour function (Z), which is a function of two inputs X, and Y (the X-axis and Y-axis coordinates).
Z = fun(x,y)
The Matplotlib provides two functions plt.contour, and plt.contourf to plot the contour plots.
The contour() Method
The matplotlib.pyplot. contour() method is used to draw contour lines. It returns the QuadContourSet. Following is the syntax of this function -
contour([X, Y,] Z, [levels], **kwargs)
Parameters
[X, Y]: Optional parameter, it represents the coordinates of the values in Z.
Z: The height values over which the contour is drawn.
levels: It is used to determine the numbers and positions of the contour lines / regions.
Example
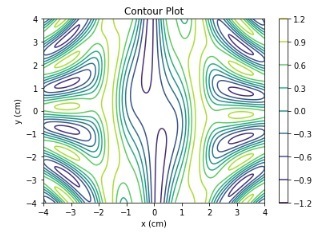
Let's take an example and plot the contour lines using the numpy trigonometric functions.
import numpy as np
import matplotlib.pyplot as plt

def f(x, y):
   return np.sin(x) ** 10 + np.cos(10 + y * x) * np.cos(x)

xlist = np.linspace(-4.0, 4.0, 800)
ylist = np.linspace(-4.0, 4.0, 800)

# A mesh is created with the given co-ordinates by this numpy function
X, Y = np.meshgrid(xlist, ylist)
Z = f(X,Y)

fig = plt.figure()
ax = fig.add_axes([0.1, 0.1, 0.8, 0.8])

cp = ax.contour(X, Y, Z)
fig.colorbar(cp) # Add a colorbar to a plot
ax.set_title('Contour Plot')

ax.set_xlabel('x (cm)')
ax.set_ylabel('y (cm)')
plt.show()
Output

The f(x,y) function is defined using the numpy trigonometric functions.
Example
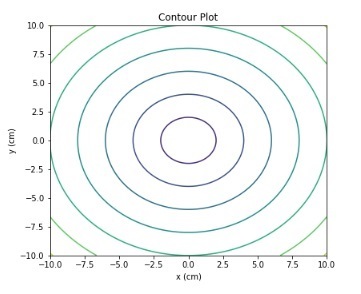
Let's take another example and draw contour lines.
import numpy as np
import matplotlib.pyplot as plt

def f(x, y):
    return np.sqrt(X**2 + Y**2)

xlist = np.linspace(-10, 10, 400)
ylist = np.linspace(-10, 10, 400)

# create a mesh
X, Y = np.meshgrid(xlist, ylist)

Z = f(X, Y)

fig = plt.figure(figsize=(6,5))
ax = fig.add_axes([0.1, 0.1, 0.8, 0.8])

cp = ax.contour(X, Y, Z)
ax.set_title('Contour Plot')
ax.set_xlabel('x (cm)')
ax.set_ylabel('y (cm)')
plt.show()
Output

The z-function is the sum of the square root of x and y coordinate values. Implemented by using the numpy.sqrt() function.
The contourf() function
The matplotlib.pyplot provides a method contourf() to draw filled contour. Following is the syntax of this function -
contourf([X, Y,] Z, [levels], **kwargs)
Where,
[X, Y]: Optional parameter, it represents the coordinates of the values in Z.
Z: The height values over which the contour is drawn.
levels: It is used to determine the numbers and positions of the contour lines / regions.
Example
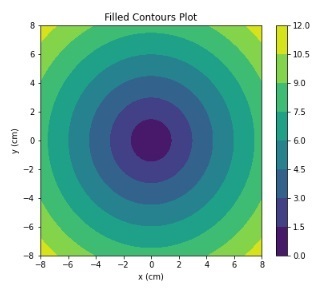
Let's take another example and draw the contour plot using the contourf() method.
import numpy as np
import matplotlib.pyplot as plt

xlist = np.linspace(-8, 8, 800)
ylist = np.linspace(-8, 8, 800)

X, Y = np.meshgrid(xlist, ylist)
Z = np.sqrt(X**2 + Y**2)

fig = plt.figure(figsize=(6,5))
ax = fig.add_axes([0.1, 0.1, 0.8, 0.8])

cp = ax.contourf(X, Y, Z)
fig.colorbar(cp) # Add a colorbar to a plot
ax.set_title('Filled Contours Plot')
#ax.set_xlabel('x (cm)')
ax.set_ylabel('y (cm)')
plt.show()
Output

Using fig.colorbar() method we have added the colours to the plot. The z function is the sum of the square root of x and y coordinates values.
Example
In this example, we will plot a Polar contour plot using the matplotlib.plt.contourf() method.
import numpy as np
import matplotlib.pyplot as plt

a = np.radians(np.linspace(0, 360, 20))
b = np.arange(0, 70, 10)

Y, X = np.meshgrid(b, a)
values = np.random.random((a.size, b.size))

fig, ax = plt.subplots(subplot_kw=dict(projection='polar'))
ax.set_title('Filled Contours Plot')
ax.contourf(X, Y, values)

plt.show()
Output

In all the above examples we have used the numpy.meshgrid() function to produce arrays for X and Y coordinates.

