
Article Categories
- All Categories
-
 Data Structure
-
 Networking
-
 RDBMS
RDBMS
-
 Operating System
-
 Java
Java
-
 MS Excel
-
 iOS
iOS
-
 HTML
HTML
-
 CSS
CSS
-
 Android
-
 Python
-
 C Programming
-
 C++
C++
-
 C#
C#
-
 MongoDB
-
 MySQL
MySQL
-
 Javascript
-
 PHP
PHP
-
 Economics & Finance
Selected Reading
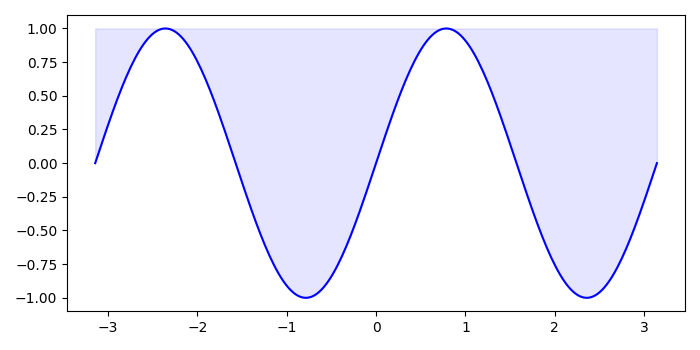
How to fill color above the curve in Matplotlib Program?
To fill color above the curve, we can take the following steps −
Steps
Initialize the variable n. Initialize x and y data points using numpy.
Create a figure and a set of subplots, fig and ax.
Plot the curve using plot() method.
Using fill_between() method, fill the area between two curves, with 1 value.
To display the figure, use show() method.
Example
import numpy as np
import matplotlib.pyplot as plt
plt.rcParams["figure.figsize"] = [7.00, 3.50]
plt.rcParams["figure.autolayout"] = True
n = 256
X = np.linspace(-np.pi, np.pi, n, endpoint=True)
Y = np.sin(2 * X)
fig, ax = plt.subplots()
ax.plot(X, Y, color='blue', alpha=1.00)
ax.fill_between(X, Y, 1, color='blue', alpha=.1)
plt.show()
Output

Updated on: 2021-05-07T08:00:35+05:30
3K+ Views

Advertisements