
Article Categories
- All Categories
-
 Data Structure
-
 Networking
-
 RDBMS
RDBMS
-
 Operating System
-
 Java
Java
-
 MS Excel
-
 iOS
iOS
-
 HTML
HTML
-
 CSS
CSS
-
 Android
-
 Python
-
 C Programming
-
 C++
C++
-
 C#
C#
-
 MongoDB
-
 MySQL
MySQL
-
 Javascript
-
 PHP
PHP
-
 Economics & Finance
Selected Reading
How to display categorical column name in facet grid in R?
To display categorical column name in facet grid, we can use the following steps −
- First of all, creating data frame.
- Loading ggplot2 package and creating a chart with facets
- Creating the chart with facets and labeller function to display categorical column name
Create the data frame
Let's create a data frame as shown below −
x<-rnorm(20)
y<-rnorm(20)
Factor<-sample(c("I","II","III"),20,replace=TRUE)
df<-data.frame(x,y,Factor)
df
On executing, the above script generates the below output(this output will vary on your system due to randomization) −
       x         y     Factor
1  -1.2961065 -1.3092987 I
2   0.5337357  0.2291017 I
3   1.7851655 -0.4845764 I
4   1.0809707  0.1879267 I
5  -0.7360667 -0.8993411 II
6  -2.1703410 -1.3451734 I
7   1.1761357  0.1834939 II
8   1.4432419  1.0218972 II
9  -0.2989334 -0.2337353 III
10  0.5419797  0.3144817 II
11 -1.2864239 -1.7106241 I
12 -1.0866636  1.2598880 I
13 -0.6756130 -0.2291350 I
14 -1.4876827 -0.4388541 III
15 -2.1607323 0.3629047 II
16 0.9352823 0.5710842 III
17 1.1757290 1.0738887 III
18 0.5019893 -0.5860239 II
19 -1.3477106 1.4709259 III
20 0.8654047 -1.4147550 III
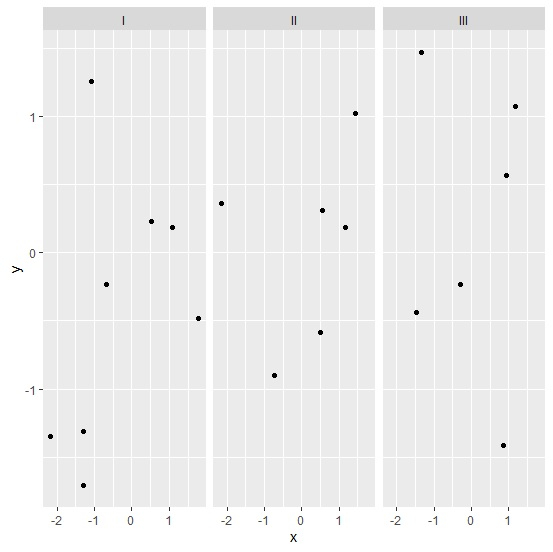
Loading ggplot2 package and creating facetted chart
Create a point chart for groups displayed in facets −
library(ggplot2)
x<-rnorm(20)
y<-rnorm(20)
Factor<-sample(c("I","II","III"),20,replace=TRUE)
df<-data.frame(x,y,Factor)
ggplot(df,aes(x,y))+geom_point()+facet_grid(~Factor)
Output
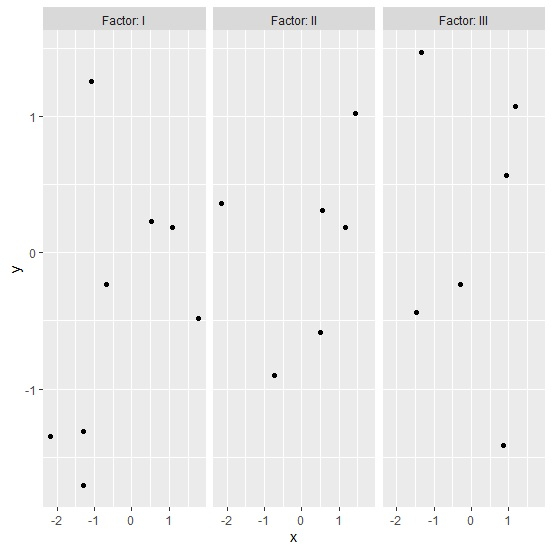
Creating facetted chart with categorical column name in facet grid
Use labeller function of ggplot2 package to create the point chart with facets having Factor column values displayed in facets −
x<-rnorm(20)
y<-rnorm(20)
Factor<-sample(c("I","II","III"),20,replace=TRUE)
df<-data.frame(x,y,Factor)
ggplot(df,aes(x,y))+geom_point()+facet_grid(~Factor,labeller=labeller(.rows=label_both,
.cols=label_both))
Output

Updated on: 2026-03-11T22:50:58+05:30
611 Views

Advertisements