
 Data Structure
 Networking
 RDBMS
RDBMS Operating System
 Java
Java MS Excel
 iOS
iOS HTML
HTML CSS
CSS Android
 Python
 C Programming
 C++
C++ C#
C# MongoDB
 MySQL
MySQL Javascript
 PHP
PHP
- Selected Reading
- UPSC IAS Exams Notes
- Developer's Best Practices
- Questions and Answers
- Effective Resume Writing
- HR Interview Questions
- Computer Glossary
- Who is Who
How to Debug Code in ES6 ?
Debugging is an essential skill for developers to identify and resolve issues in their code. With the arrival of ES6 (ECMAScript 2015), JavaScript introduced several new features and syntax improvements. We can debug code in ES6 using various methods like Using Console Statements, Leveraging Debugging Tools, Employing Breakpoints, Analyzing Stack Traces, Debugging Asynchronous Code, and Advanced Debugging Techniques. This article will provide a detailed guide on how to effectively debug code in ES6.
Setting Up a Development Environment
Before we start debugging ES6 code, it's important to set up a suitable development environment. We can choose any code editor or Integrated Development Environment (IDE) of our preference. Popular options include Visual Studio Code, WebStorm, and Atom. Ensure that your environment supports ES6 syntax and provides debugging capabilities.
Understanding Common Debugging Techniques
Some universal debugging techniques include analyzing error messages, reviewing code flow, and inspecting variable values. These fundamental practices apply equally to ES6 debugging. These are common debugging techniques regardless of the programming language we are using.
Using Console Statements
The console is an indispensable tool for debugging in JavaScript. ES6 enhances the capabilities of the console by introducing new features like template literals and arrow functions.
Example
In the below example, we have a calculateArea function that calculates the area of a circle based on the given radius. We use console.log statements to print informative messages during execution. The first log statement displays the radius value, while the second log statement outputs the calculated area. These console logs provide insights into the flow of the program and help identify any incorrect values or unexpected behavior.
const calculateArea = (radius) => {
  console.log(`Calculating area for radius: ${radius}`);
  const area = Math.PI * radius * radius;
  console.log(`The area is: ${area}`);
  return area;
};

calculateArea(5);
Output
Calculating area for radius: 5
The area is: 78.53981633974483
Leveraging Debugging Tools
Modern web browsers offer powerful built?in debugging tools that are useful in ES6 debugging. The most commonly used tool is the browser's Developer Console. It provides features like live code execution, breakpoints, step?by?step debugging, and variable inspection. To access the Developer Console in Chrome or Firefox, right?click on a web page, select "Inspect," and navigate to the "Console" tab. Also, you can use keyboard shortcuts (Ctrl + Shift + J in Chrome and Ctrl + Shift + K in Firefox).
Employing Breakpoints
Breakpoints are markers placed in the code that pause program execution at specific points. They enable developers to inspect variable values and step through code to identify issues.
Example
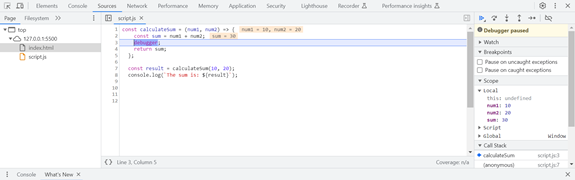
In the below code snippet, we have a calculateSum function that adds two numbers and returns their sum. We have placed a debugger statement, which acts as a breakpoint, to halt execution at that point. The debugger statement triggers the browser's debugging tools, allowing us to analyze the code at runtime.
const calculateSum = (num1, num2) => {
  const sum = num1 + num2;
  debugger;
  return sum;
};

const result = calculateSum(10, 20);
console.log(`The sum is: ${result}`);
Output
When the code execution hits the debugger statement, the browser's debugging tools will open. Developers can inspect variable values, execute code step?by?step, and observe the state of the program. In this case, the debugger will display the current values of num1, num2, and sum.
The sum is: 30
Analyzing Stack Traces
Stack traces are invaluable when it comes to understanding the sequence of function calls that led to an error. They provide a detailed report of the function call stack at the moment an exception occurred. Stack traces can be accessed from the browser's Developer Console or the terminal.
Example
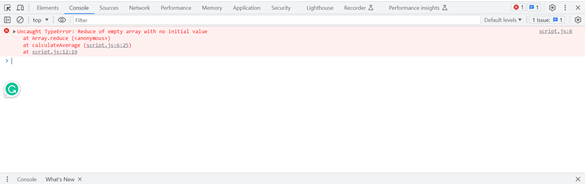
In the below code, we have a divideNumbers function that calculates the quotient of two numbers. The calculateAverage function uses divideNumbers to calculate the average of an array of numbers. However, if the denominator is zero, a division by zero error will occur.
const divideNumbers = (numerator, denominator) => {
  return numerator / denominator;
};

const calculateAverage = (numbers) => {
  const sum = numbers.reduce((acc, val) => acc + val);
  const average = divideNumbers(sum, numbers.length);
  return average;
};

const numbers = [];
const average = calculateAverage(numbers);
console.log(`The average is: ${average}`);
Output
When an exception occurs, the browser's Developer Console displays a stack trace. It reveals the sequence of function calls that led to the error. In this example, the stack trace will highlight the line numbers and functions involved in the error, allowing developers to identify the root cause.
Debugging Asynchronous Code
ES6 introduced several features to handle asynchronous programmings, such as Promises and async/await. Debugging asynchronous code can be challenging due to its non?linear flow. To debug such code effectively, we can combine console statements, breakpoints, and step?by?step debugging.
Example
In the below code snippet, we have an async function fetchData that fetches data from an API using the fetch function. We use console.log statements to indicate the progress of the asynchronous operations. The code utilizes the async/await syntax to handle the asynchronous flow and ensure sequential execution.
const fetchData = async () => {
  console.log("Fetching data...");
  const response = await fetch("https://api.example.com/data");
  const data = await response.json();
  console.log("Data fetched successfully!");
  return data;
};

fetchData()
  .then((data) => console.log(data))
  .catch((error) => console.error(error));
Output
In the below code snippet, we have an async function fetchData that fetches data from an API using the fetch function. We use console.log statements to indicate the progress of the asynchronous operations. The code utilizes the async/await syntax to handle the asynchronous flow and ensure sequential execution.
Fetching data...
Data fetched successfully!
{...} // Data object
Advanced Debugging Techniques
Besides the techniques discussed above, there are additional advanced debugging techniques available, such as: Using linters and static analysis tools to catch potential errors and code smells early in the development process. Employing unit tests and test runners to identify issues and ensure code quality. Utilizing browser extensions and third?party debugging tools to enhance the debugging experience.
Conclusion
In this article, we discussed how we can debug ES6 code. By employing console statements, leveraging debugging tools, and mastering breakpoints, stack traces, and asynchronous code debugging, developers can identify and fix issues efficiently. With the techniques discussed in this article, you can enhance your ES6 debugging skills and become a more proficient JavaScript developer.

257 Views
