
Article Categories
- All Categories
-
 Data Structure
-
 Networking
-
 RDBMS
RDBMS
-
 Operating System
-
 Java
Java
-
 MS Excel
-
 iOS
iOS
-
 HTML
HTML
-
 CSS
CSS
-
 Android
-
 Python
-
 C Programming
-
 C++
C++
-
 C#
C#
-
 MongoDB
-
 MySQL
MySQL
-
 Javascript
-
 PHP
PHP
-
 Economics & Finance
How to deal with hist.default, 'x' must be numeric in R?
The error hist.default, 'x' must be numeric occurs when we pass a non-numerical column or vector to the hist function. If we have a non-numerical column in a data frame or a non-numerical vector and we want to create the histogram of that data can be created with the help of barplot and table function.
Check out the below given Example
to understand how it can be done.
Example
Following snippet creates a sample data frame −
x<-sample(LETTERS[1:5],20,replace=TRUE)
df<-data.frame(x)
df
The following dataframe is created
   x
 1 C
 2 B
 3 B
 4 B
 5 E
 6 E
 7 C
 8 A
 9 C
10 B
11 D
12 E
13 A
14 C
15 B
16 A
17 C
18 E
19 B
20 B
To create histogram of x with hist function on the above created data frame, add the following code to the above snippet −
x<-sample(LETTERS[1:5],20,replace=TRUE)
df<-data.frame(x)
hist(df$x)
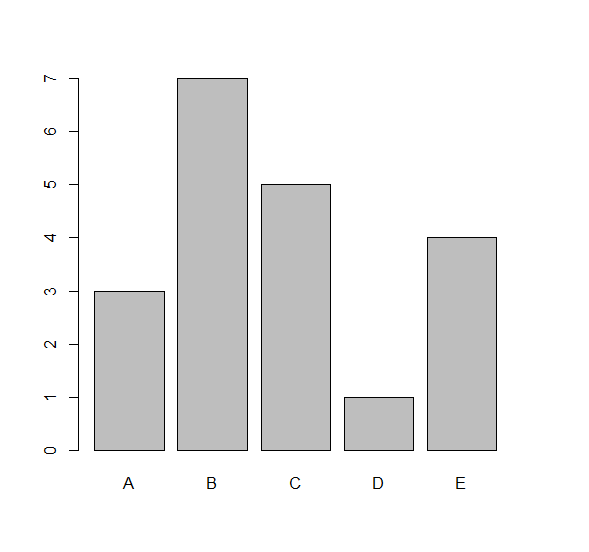
To create histogram of x with barplot function on the above created data frame, add the following code to the above snippet −
x<-sample(LETTERS[1:5],20,replace=TRUE)
df<-data.frame(x)
barplot(table(df$x))
Output
If you execute all the above given snippets as a single program, it generates the following Output −

9K+ Views
