
Article Categories
- All Categories
-
 Data Structure
-
 Networking
-
 RDBMS
RDBMS
-
 Operating System
-
 Java
Java
-
 MS Excel
-
 iOS
iOS
-
 HTML
HTML
-
 CSS
CSS
-
 Android
-
 Python
-
 C Programming
-
 C++
C++
-
 C#
C#
-
 MongoDB
-
 MySQL
MySQL
-
 Javascript
-
 PHP
PHP
-
 Economics & Finance
Selected Reading
How to create histogram of all columns in an R data frame?
To create histogram of all columns in an R data frame, we can use hist.data.frame function of Hmisc package. For example, if we have a data frame df that contains five columns then the histogram for all the columns can be created by using a single line code as hist.data.frame(df).
Example
Consider the below data frame −
set.seed(9)
x1<-rnorm(20,5,1.09)
x2<-rnorm(20,5,0.80)
x3<-rnorm(20,5,0.50)
x4<-rnorm(20,5,0.02)
x5<-rnorm(20,5,0.15)
df<-data.frame(x1,x2,x3,x4,x5)
df
Output
      x1       x2       x3       x4      x5
1 4.164192 6.405594 4.595772 5.005624 5.017111
2 4.110060 5.145802 3.990309 4.975946 4.841951
3 4.845727 4.786489 4.630638 5.009303 5.023400
4 4.697411 5.741137 5.191443 5.007040 5.195059
5 5.475575 4.445334 5.865432 4.988203 4.826617
6 3.706309 7.145592 4.898459 4.982928 5.032406
7 6.299266 5.178020 4.501801 4.995065 5.120672
8 4.980173 4.434662 4.346732 5.030787 4.890183
9 4.729588 5.333771 4.501084 5.010922 4.757285
10 4.604399 5.295645 4.717486 5.031299 5.125860
11 6.392552 4.268989 5.876029 5.004993 4.947284
12 4.488902 4.746468 4.726114 4.960752 4.892557
13 5.077449 5.839247 4.570737 4.983819 4.858956
14 4.710018 5.134489 5.024647 4.990026 5.109525
15 7.011330 5.025152 4.899978 5.006102 4.934319
16 4.085000 4.191736 4.448023 4.994216 4.962593
17 4.915582 5.306201 5.120294 5.029154 4.899189
18 2.146701 4.344243 5.190557 5.017475 5.120152
19 5.967794 5.289369 6.115229 4.980941 4.776671
20 4.228834 5.074697 5.599601 4.999366 5.068102
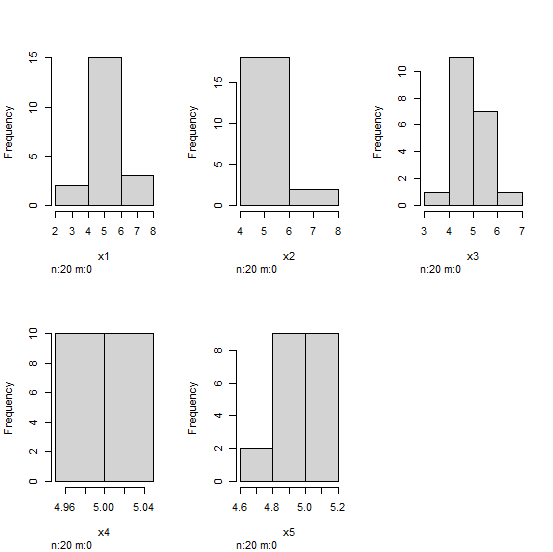
Loading Hmisc package and creating histograms for all columns of data frame df −
Example
library(Hmisc)
hist.data.frame(df)
Output
Let’s have a look at another example −
Example
y1<-rnorm(5000,5,1.09)
y2<-rnorm(5000,5,0.80)
y3<-rnorm(5000,5,0.50)
y4<-rnorm(5000,5,0.02)
df_y<-data.frame(y1,y2,y3,y4)
head(df_y,20)
Output
      y1       y2       y3       y4
1 7.360122 2.477397 5.692058 4.997948
2 2.834658 5.737269 5.038057 4.995741
3 4.877497 4.688126 4.400630 5.018846
4 7.241674 5.875059 5.376843 4.987899
5 3.871008 3.597722 4.785035 5.012924
6 5.148704 5.933472 5.349004 4.952439
7 5.908375 5.956353 5.606131 4.966737
8 4.537790 4.034598 5.473110 4.969043
9 4.725682 4.965986 4.771915 5.027725
10 4.678440 4.453948 5.607061 5.011792
11 5.387485 5.280068 5.693234 4.979037
12 4.057784 6.449363 5.357565 5.004431
13 3.429349 5.513883 5.054941 5.018333
14 5.102066 5.222584 4.907678 4.966319
15 4.983114 4.286539 4.471304 5.009501
16 6.535382 4.201185 4.994638 5.006412
17 2.647908 4.998439 4.741445 5.006141
18 6.798399 4.785914 6.068729 5.003509
19 5.574891 4.538196 4.722987 5.017613
20 4.149567 5.098584 4.476465 4.990768
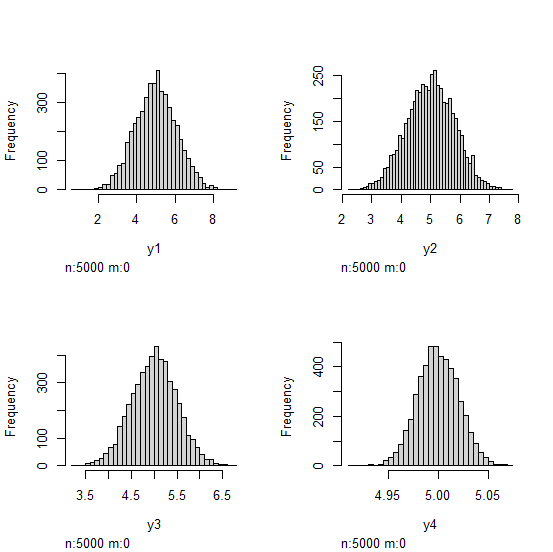
Creating histograms for all columns of data frame df_y −
Example
hist.data.frame(df_y)
Output

Updated on: 2026-03-11T22:50:52+05:30
15K+ Views

Advertisements