 Data Structure
 Networking
 RDBMS
RDBMS Operating System
 Java
Java MS Excel
 iOS
iOS HTML
HTML CSS
CSS Android
 Python
 C Programming
 C++
C++ C#
C# MongoDB
 MySQL
MySQL Javascript
 PHP
PHP
- Selected Reading
- UPSC IAS Exams Notes
- Developer's Best Practices
- Questions and Answers
- Effective Resume Writing
- HR Interview Questions
- Computer Glossary
- Who is Who
How to create animations in python?
Python provides several libraries for creating animations, such as Matplotlib, Pygame, and Pyglet. Matplotlib is a popular Python data visualisation library that also offers the functionality of creating animations using the ?FuncAnimation' function. ?FuncAnimation' is a class in the ?matplotlib.animation' module that creates animations by calling a user-defined function. In this tutorial, we will learn animations using the ?FuncAnimation' function, and we will illustrate three examples of this method.
Syntax
animation = FuncAnimation(fig, animate_func, frames=frame_values, interval=interval_value, repeat=repeat_value)
In the above syntax, fig is the object that we want to animate, animate_func updates the plot for each frame, ?frame_values' is iterable of values that determine the frames to be shown, ?interval_value' is the time interval between frames in milliseconds, and ?repeat_value' is a boolean that determines whether the animation should repeat after it finishes.
Example 1
In this example, we created a figure object, ?fig', and ?an' axes object ax using the ?subplots()' function. Next, we created a numpy array ?x' with 200 points between 0 and 2?, and a line object ?line' that plots the sine of ?x'.
The ?animate()' function is called for each frame of the animation, and it updates the y-data of the ?line' object by adding ?i/10.0' to ?x'. The function then returns the ?line' object. After that, we created an instance of ?FuncAnimation' by passing in ?fig', ?animate', ?frames=100' to indicate that we want to show 100 frames, and ?interval=50' to set the time interval between frames to 50 milliseconds. We then called ?plt.show()' to display the animation.
Here's a simple example that creates an animation of a sine wave ?
import numpy as np
import matplotlib.pyplot as plt
from matplotlib.animation import FuncAnimation

fig, ax = plt.subplots()
x = np.linspace(0, 2*np.pi, 200)
line, = ax.plot(x, np.sin(x))

def animate(i):
   line.set_ydata(np.sin(x + i/10.0))
   return line,
animation = FuncAnimation(fig, animate, frames=100, interval=50)
plt.show()
Output

Example 2
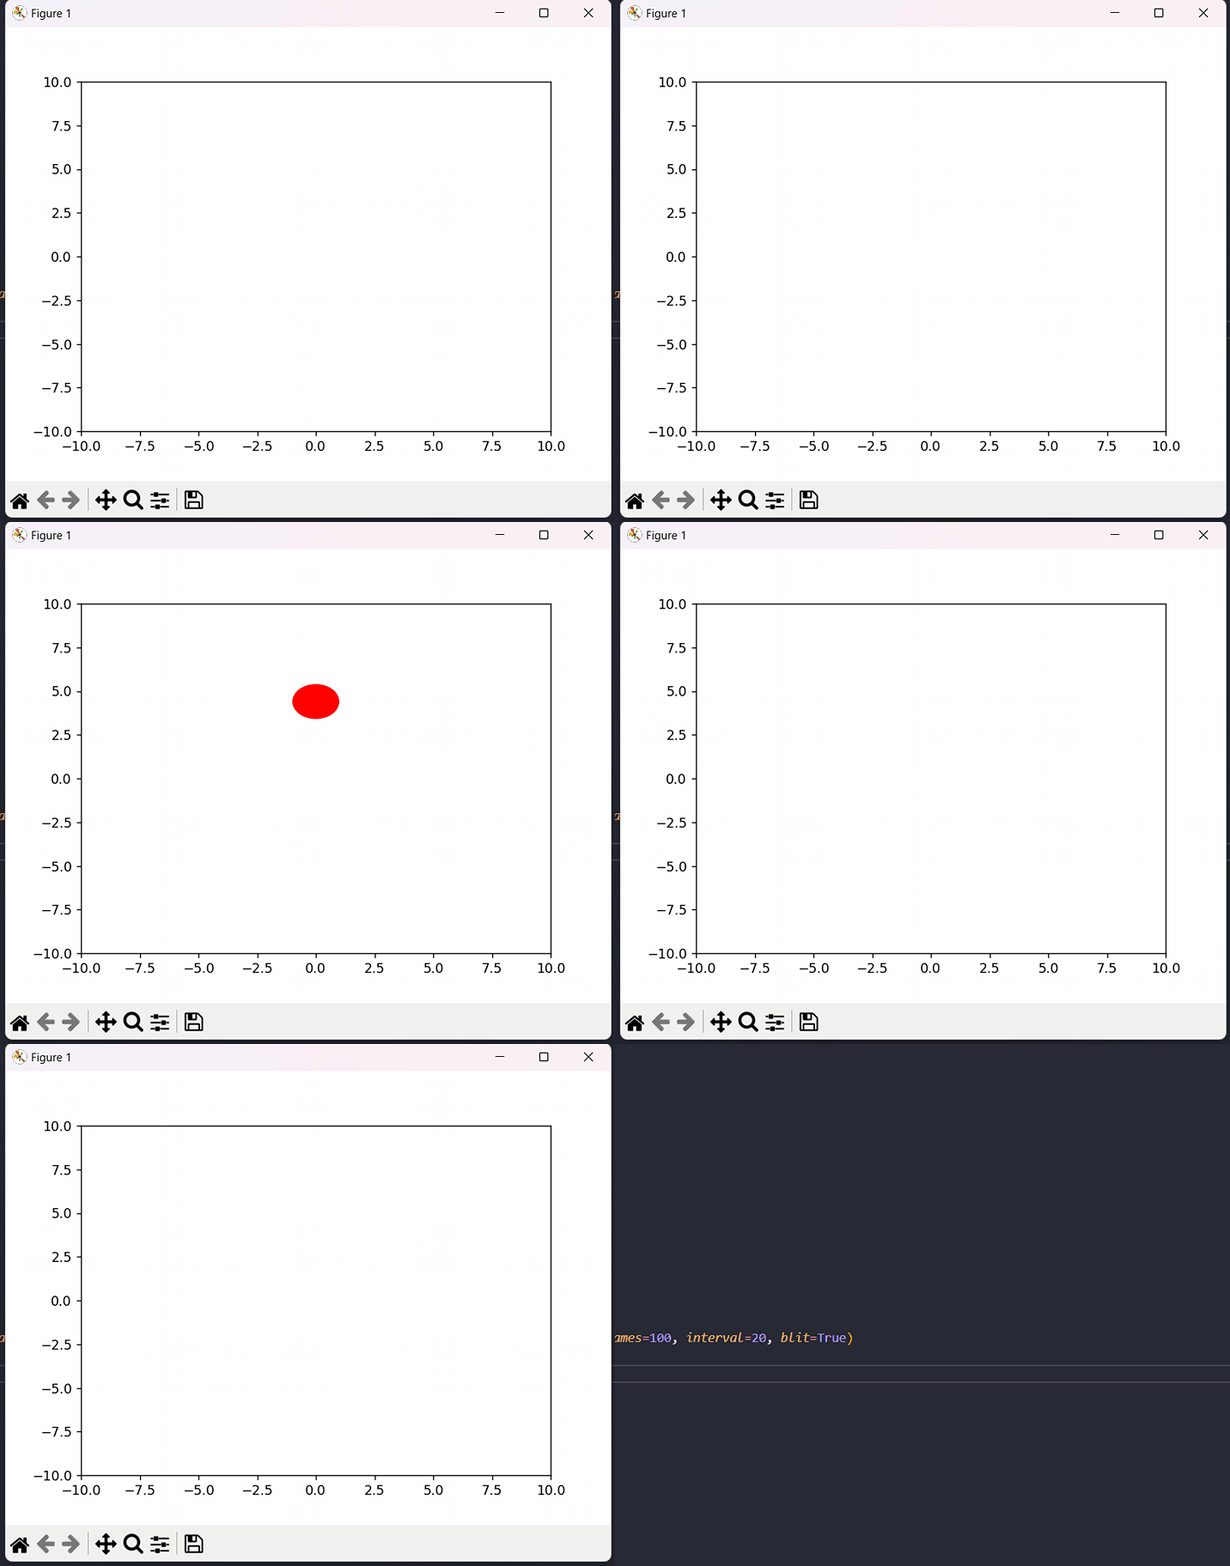
In this example, we animated a ball rolling vertically in the middle of the plot using ?FuncAnimation'. First, we created a ?circle' object circle using ?plt.Circle()', sets the x and y limits of ?ax' in the ?init()' function, and adds the ?circle' object to the axes. In the ?animate()' function, the vertical position of the ?circle' is updated using the ?i' variable, and the ?circle' object is returned.
After then, an instance of FuncAnimation is created using ?fig', ?animate', ?init_func=init', ?frames=100', ?interval=20', and ?blit=True'. Then the animation is displayed using ?plt.show()'.
import numpy as np
import matplotlib.pyplot as plt
from matplotlib.animation import FuncAnimation
fig, ax = plt.subplots()
circle = plt.Circle((0, 0), 1, fc='r')

def init():
   ax.set_xlim(-10, 10)
   ax.set_ylim(-10, 10)
   ax.add_artist(circle)
   return circle,

def animate(i):
   x, y = circle.center
   circle.center = (x, i/5)
   return circle,

animation = FuncAnimation(fig, animate, init_func=init, frames=100, interval=20, blit=True)
plt.show()
Output

Example 3
In this example, we animated two lines moving horizontally. First, we created a figure object ?fig', and an axes object ?ax'. Then we defined two line objects ?x1_line' and ?x2_line', representing the two lines moving horizontally.
The ?init()' function is called to initialize the plot. We set the x and y limits of ?ax' and return the ?x1_line' and ?x2_line' objects. Next, the ?animate()' function is called for each frame of the animation, and it updates the data of the ?x1_line' and ?x2_line' objects. We generate a numpy array ?x1' with 100 points between 0 and 10, and a numpy array ?y1', a sine wave with amplitude 1 and phase shift -i/10.0. We then set the x-data of ?x1_line' to ?x1' and the y-data to ?y1'.
Similarly, we generate a numpy array ?x2' with 100 points between 0 and 10, and a numpy array ?y2', a cosine wave with amplitude 1 and phase shift -i/10.0. We then set the x-data of ?x2_line' to ?x2' and the y-data to ?y2'. After then, we created an instance of ?FuncAnimation' by passing in ?fig', ?animate', ?init_func=init', ?frames=100' to indicate 100 frames, and ?interval=50' to set the time interval between frames to 50 milliseconds. We also set ?blit=True' for performance. We then call ?plt.show()' for the display.
import numpy as np
import matplotlib.pyplot as plt
from matplotlib.animation import FuncAnimation

fig, ax = plt.subplots()
x1_line, = ax.plot([], [])
x2_line, = ax.plot([], [])

def init():
   ax.set_xlim(0, 10)
   ax.set_ylim(-1, 1)
   return x1_line, x2_line

def animate(i):
   x1 = np.linspace(0, 10, 100)
   y1 = np.sin(x1 - i/10.0)
   x1_line.set_data(x1, y1)
   x2 = np.linspace(0, 10, 100)
   y2 = np.cos(x2 - i/10.0)
   x2_line.set_data(x2, y2)
   return x1_line, x2_line

animation = FuncAnimation(fig, animate, init_func=init, frames=100, interval=50, blit=True)
plt.show()
Output

Conclusion
We learned that matplotlib is a popular library for data visualization in Python, and creating animations using ?FuncAnimation' makes a basic understanding of how to use matplotlib to create plots and customize them. Creating animations using ?FuncAnimation' in Python is a great way to gain a basic understanding of how animation works and how to use matplotlib to create engaging visualizations. Through creating animations, one can enhance their Python programming skills and develop problem-solving skills by tackling challenges such as updating the plot in each frame, controlling the animation speed, and handling errors and exceptions. Additionally, creating animations allows creativity and innovation to come into play, as one can design visually appealing and interactive animations to communicate complex data and concepts effectively. Overall, one can create animations using this method and customize them further.

