
Article Categories
- All Categories
-
 Data Structure
-
 Networking
-
 RDBMS
RDBMS
-
 Operating System
-
 Java
Java
-
 MS Excel
-
 iOS
iOS
-
 HTML
HTML
-
 CSS
CSS
-
 Android
-
 Python
-
 C Programming
-
 C++
C++
-
 C#
C#
-
 MongoDB
-
 MySQL
MySQL
-
 Javascript
-
 PHP
PHP
-
 Economics & Finance
Selected Reading
How to create a qqplot with confidence interval in R?
A qqplot is the plot of quantiles that helps to understand whether the supplied data comes from the specified distribution, mostly it is used to check whether the data follows normal distribution or not. If we want to create the qqplot with confidence interval then qqPlot function of car package can be used as shown in the below example.
Consider the below data frame −
Example
x<-rnorm(20,74,3.5)
y<-rnorm(20,50,2.25)
df<-data.frame(x,y)
df
Output
       x      y
1  73.30956  51.31650
2  78.67091  51.01323
3  71.34887  46.93155
4  81.89449  51.54427
5  70.74800  55.81567
6  71.84334  50.74052
7  70.50627  50.35543
8  75.99494  48.10296
9  72.22310  50.42166
10 76.17660  47.82578
11 70.23273  45.80355
12 77.38643  47.50654
13 76.91476  51.83949
14 69.65716  48.11115
15 74.00487  52.76651
16 74.25146  53.72022
17 73.83530  50.83250
18 68.10708  50.85800
19 73.75495  50.37560
20 73.99065  52.60846
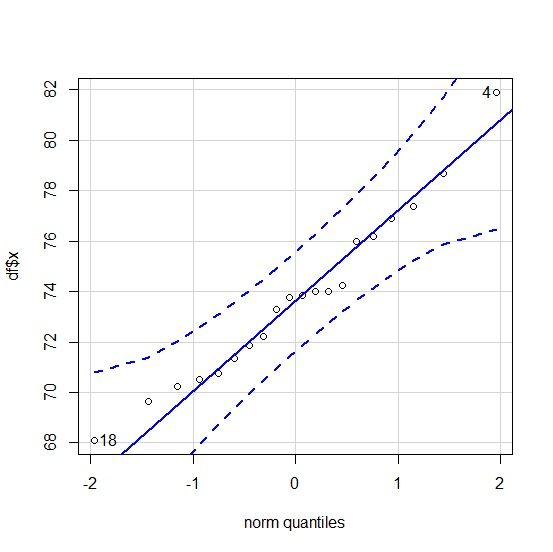
Loading car package and creating the qqplot with confidence interval −
Example
library(car)
qqPlot(df$x)
[1] 4 18
Output

Updated on: 2026-03-11T22:50:55+05:30
3K+ Views

Advertisements