 Data Structure
 Networking
 RDBMS
RDBMS Operating System
 Java
Java MS Excel
 iOS
iOS HTML
HTML CSS
CSS Android
 Python
 C Programming
 C++
C++ C#
C# MongoDB
 MySQL
MySQL Javascript
 PHP
PHP
- Selected Reading
- UPSC IAS Exams Notes
- Developer's Best Practices
- Questions and Answers
- Effective Resume Writing
- HR Interview Questions
- Computer Glossary
- Who is Who
How to Calculate and Plot the Derivative of a Function Using Python – Matplotlib?
The Derivative of a function is one of the key concepts used in calculus. It is a measure of how much the function changes as we change the output.
Whereas Matplotlib is a plotting library for python, since it does not provide a direct method to calculate the derivative of a function you need to use NumPy, which is also one of the python libraries and you can use it to calculate the derivative of a function and Matplotlib for visualizing the results.
In this article, we will be calculating the derivative of a function using the NumPy library and visualize it with the help of Matplotlib in Python.
What is the Derivative of a Function?
A derivative is the rate at which a function changes with respect to its input. It gives the slope of the tangent line of the function at any point, and can also be used to find maxima, minima, critical points, and inflection points. Derivative of function f(x) is defined as the limit of the difference quotient as the changes in x approaches zero. A mathematical statement explaining it is as following:
f`(x) = lim (h -> 0) [(f(x + h) - f(x)) / h]
Here, the limit denotes the instant rate of change of the function at x.
What is Matplotlib in Python?
Matplotlib is one of the most popular visualization libraries for Python. It is extensively used in the scientific computing community. It supports a variety of plot types and presents many customization options, it also integrates with NumPy and other scientific computing libraries.
Calculating Derivative of a Function Using Matplotlib
Since we do not have any direct method in Matplotlib to calculate the derivative of a function we need to use the formula to calculate the derivative and, plot result using a graph. Follow the steps given below to do so -
Step 1 - First of all import the required modules i.e. matplotlib and numpy.
import numpy as np
import matplotlib.pyplot as plt
Step 2 - After importing the modules, define a function which you want to differentiate. Let's take f(x) = x2
Def f(x):
    return x**2
Step 2 - Now, define the range of x values over which to plot the functions and the derivative. Let's take a range of [-4, 4]
x = np.linspace(-4, 4, 1000)
Step 3 - Then, using the gradient() function of numpy we can calculate the derivate of the function. The work of this function is to calculate the numerical gradient of an array of values, which is an approximation of the derivative.
dfdx = np.gradient(f(x), x)
Step 4 - For plotting the original function and its derivative, we will use matplotlib. As an output a plot will be created.
plt.plot(x, f(x), label = ?f(x)')
plt.plot(x, dfdx, label = ?df/dx')
plt.legend()
plt.show()
Example
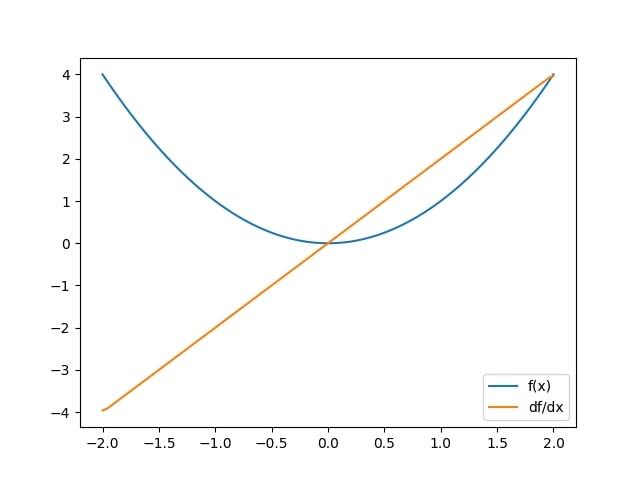
After following all the steps, the code and the output will be as following:
import numpy as np
import matplotlib.pyplot as plt
def f(x):
    return x**2
x = np.linspace(-2, 2, 100)
dfdx = np.gradient(f(x), x)
plt.plot(x, f(x), label='f(x)')
plt.plot(x, dfdx, label='df/dx')
plt.legend()
plt.show()
Output

Example
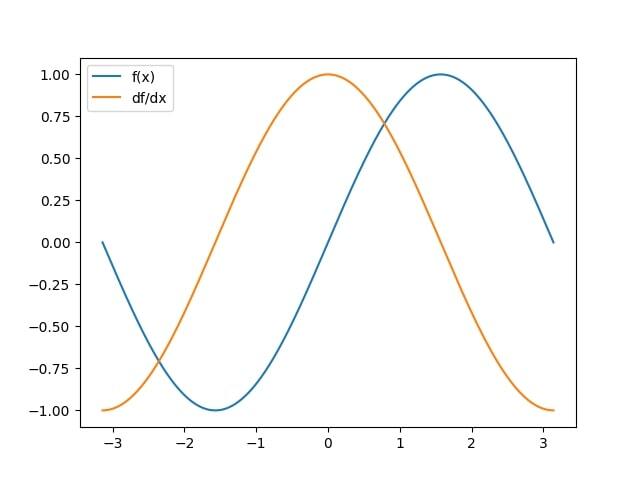
Here, we will first define the function as f(x) = sin(x) and then by using NumPy's gradient function we will calculate its derivative. Then we will try to plot both the original function f(x) and the derivative df/dx using Matplotlib's plot() function.
import numpy as np
import matplotlib.pyplot as plt
def f(x):
    return np.sin(x)
x = np.linspace(-np.pi, np.pi, 1000)
dfdx = np.gradient(f(x), x)

fig, ax = plt.subplots()
ax.plot(x, f(x), label='f(x)')
ax.plot(x, dfdx, label="df/dx")
ax.legend()
plt.show()
Output

Example
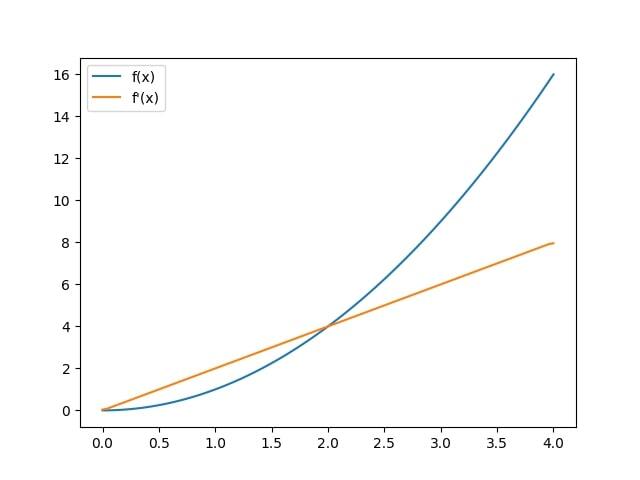
The first step is to define the function which we want to differentiate using the numpy power function. Then, for computing the derivative of the function at a set of points, we will use the gradient() function.
The role of this function is to take an array of values and then return an array of same shape having the numerical derivatives of the geiven values.
import matplotlib.pyplot as plt
import numpy as np
def f(x):
    return np.power(x, 2)
x = np.linspace(0, 4, 100)
y = f(x)
dy = np.gradient(y, x)
plt.plot(x, y, label='f(x)')
plt.plot(x, dy, label="f'(x)")
plt.legend()
plt.show()
Output

Here, in each case, we have first defined the function that we want to calculate the derivative of. We have created x-axis values using the linspace() function from numpy, and used them to calculate the derivative values. Finally, we plot the function and its derivative using the plot function and add a legend to the graph using the legend function.
Conclusion
In this article, we have calculated the derivative of a function using python - Matplotlib. We have used different functions such as gradient() to calculate the derivative, linspace() for the range of values, and plot() to plot the function as well as its derivative respectively.

