
Article Categories
- All Categories
-
 Data Structure
-
 Networking
-
 RDBMS
RDBMS
-
 Operating System
-
 Java
Java
-
 MS Excel
-
 iOS
iOS
-
 HTML
HTML
-
 CSS
CSS
-
 Android
-
 Python
-
 C Programming
-
 C++
C++
-
 C#
C#
-
 MongoDB
-
 MySQL
MySQL
-
 Javascript
-
 PHP
PHP
-
 Economics & Finance
How are Outliers Determined in Seaborn using Boxplot?
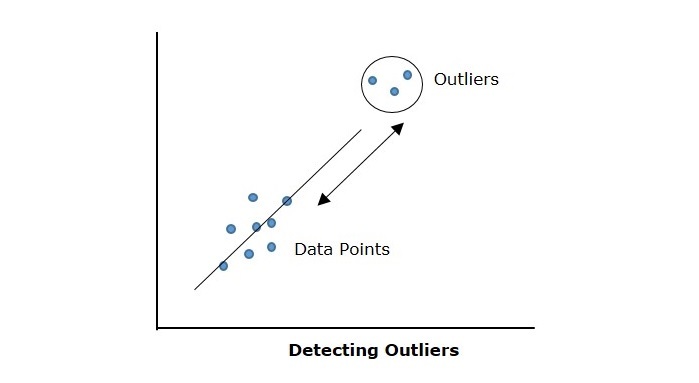
What are Outliers?
Outliers are the data points or observations which are far from the other points in a dataset. Outliers are caused due to measurement error, data entry error or experimental error etc. Outliers can skew the dataset which effects in statistical analysis and can increase the standard deviation of the dataset further effecting model prediction.
An outlier may be a valid data point or can be noise.
For a better understanding let us look at an example scenario. Imagine you are collecting data of student's height (age between 9 to 12 years). Most of the students are around 4 feet tall. But there are couple of students who have entered incorrect height as 7 feet. That unusual and incorrect height is an outlier, because it is significantly different from others. In simple terms, outliers are like the odd ones out, which doesn't fit well with the rest of the group.
Why Should we Remove Outliers?
Removing outliers is a significant step as part of data preprocessing. Considering a dataset with outliers, if not removed and a machine learning model is being trained on that dataset, the model will try covering the outlier points too, which will result in poor generalization of the predictive model.
In this scenario, while covering the outliers, the model becomes complex for the dataset further resulting in over fitting and false prediction on new dataset. One of the easiest way to remove outliers is using boxplot, Following section discusses how we can identify the outliers with help of boxplot.
Statistical Analysis of Boxplot
Boxplot is also known as Whisker plot, it is graphical representation of the distribution of the dataset. It helps us in interpreting the data points weather they are less dispersed or more dispersed. It also explains the skewness of the dataset
Using the boxplot we can understand the statistical information about Min, Max, and Inter quartiles ranges(Q1, Q2, Q3) of a dataset.
Where
Min The Min value determines the minimum data point in the dataset
Max The Max value determines the maximum data point in the dataset
First Quartile(Q1) When the data points are divided into two halves, Q1 is the median of the lower half of the data points. It is the 25th percentile of the data points
Second Quartile or Median(Q2) Q2 is the Median of the entire data points
Third Quartile(Q3) When the data points are divided into two halves, Q3 is the median of the upper half of the data points. It is the 75th percentile of the data points
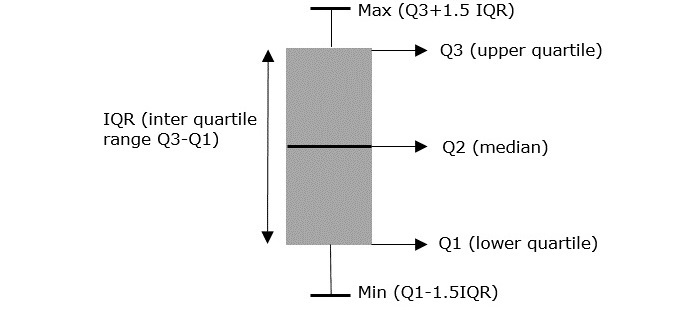
In any Dataset the records which are greater than Q3+1.5IQR or less than Q1-1.5IQR those are said to be outliers
The longer the box, the more spread out the data, the shorter the box, the less spread out the data.
Detecting Outliers Using Seaborn
Seaborn is a data visualization library hinge on matplotlib, it can create complex visualization plots and provides default color palette which results in aesthetic plots.
We can create a boxplot in seaborn using boxplot() function. Following is the syntax of boxplot() function in Seaborn
seaborn.boxplot(x=, y=, heu=, data=)
Where,
x, y, heu Name of the features in the dataset.
data Dataset used for plotting.
Example
In the following example we will be plotting the titanic dataset using box plot and try to determine the outliers in it.
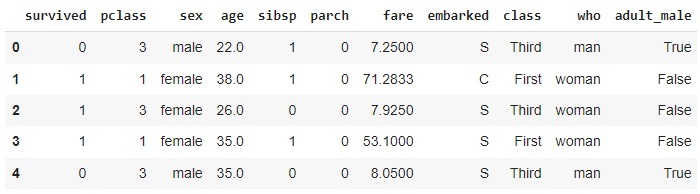
In this Titanic dataset we have 891 records and 15 features. describing about the survival status of the passengers on the Titanic.
These are the first five rows in dataset.
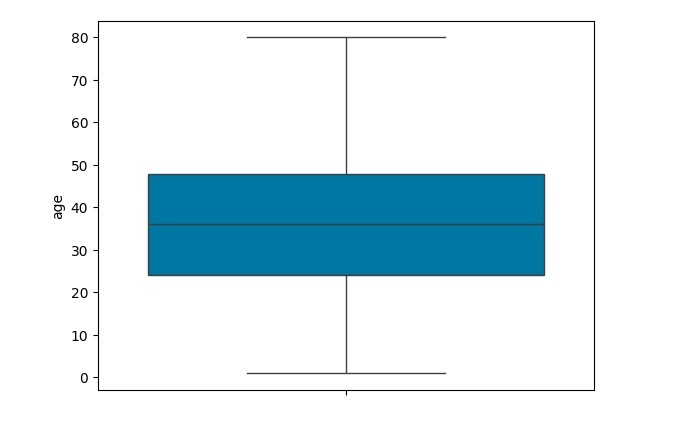
When we plot the boxplot for "age" feature using "sns.boxplot()". The data points which are above max value and below min value are considered as outliers.
import pandas as pd
import seaborn as sns
import matplotlib.pyplot as plt

dataset= sns.load_dataset('titanic')
sns.boxplot(y=dataset['age'])
plt.show()
Output
On executing the above program you will get the following output
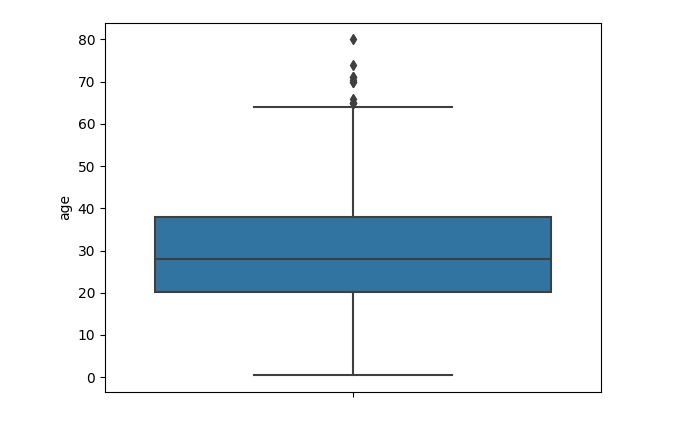
Considering the output, it is depicted that, Age>65 are the outlier points
Example
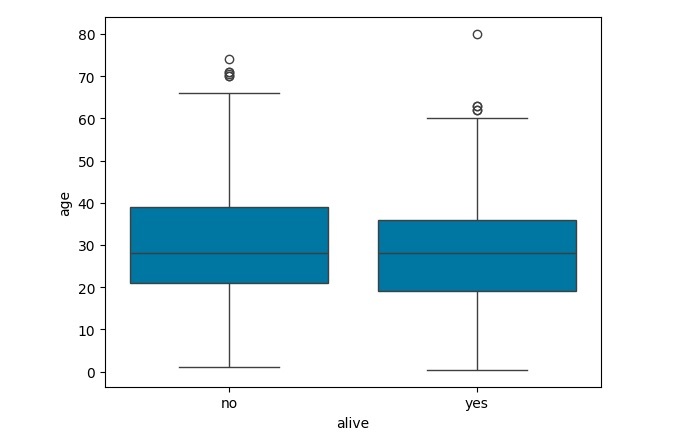
As we have used a single numerical feature in the above example, here we have considered one categorical feature (alive) on x-axis and one numerical feature (age) on y-axis
import pandas as pd
import seaborn as sns
import matplotlib.pyplot as plt

dataset= sns.load_dataset('titanic')
sns.boxplot(data=dataset, x="alive", y="age")
plt.show()
Output
On executing the above program you will get the following output
Example
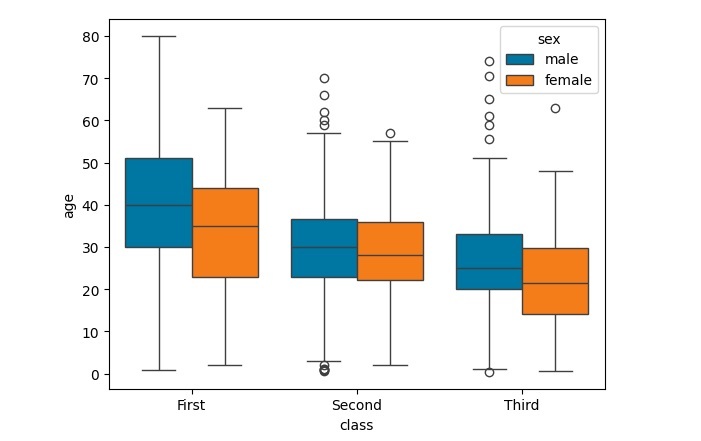
Here we have considered a categorical feature(class) and determined the outliers with respect to the age feature comparing the plots with another categorical feature (sex)
import pandas as pd
import seaborn as sns
import matplotlib.pyplot as plt

dataset= sns.load_dataset('titanic')
sns.boxplot(x="class",y="age",hue="sex",data=dataset)
plt.show()
Output
On executing the above program you will get the following output
Dropping Outliers
One of the ways to drop an outlier is to identify the minimum and maximum values and discard the dataponits that falls out of the range of these (make them null and drop them).
Example
In the following example we are choosing the age feature and removing the identified outliers
We first have to calculate Q1 and Q3 values and further calculate interquartile range (Q3-Q1).
After computing the interquartile range, compute the values of Q3+1.5IQR and Q1-1.5IQR as specified and, the data points are said to be outliers, if they are greater than Q3+1.5IQR and less than Q1-1.5IQR.
Finally, Replace those outlier values as null values and further drop those null values using .dropna. Check weather the outliers are removed by plotting boxplot once again.
import pandas as pd
import seaborn as sns
import matplotlib.pyplot as plt

dataset= sns.load_dataset('titanic')
for i in ['age']:
   q75,q25=np.percentile(dataset.loc[:,i],[75,25])
   intr_qr= q75-q25
   max = q75+(1.5*intr_qr)
   min = q25-(1.5*intr_qr)
   dataset.loc[dataset[i]<min,i]=np.nan
   dataset.loc[dataset[i]>max,i]=np.nan
dataset=dataset.dropna(axis=0)
sns.boxplot(y=dataset['age'])
plt.show()
Output
On executing the above program you will get the following output

2K+ Views
