
Article Categories
- All Categories
-
 Data Structure
-
 Networking
-
 RDBMS
RDBMS
-
 Operating System
-
 Java
Java
-
 MS Excel
-
 iOS
iOS
-
 HTML
HTML
-
 CSS
CSS
-
 Android
-
 Python
-
 C Programming
-
 C++
C++
-
 C#
C#
-
 MongoDB
-
 MySQL
MySQL
-
 Javascript
-
 PHP
PHP
-
 Economics & Finance
How to highlight outliers in a boxplot in R?
To highlight outliers in a boxplot, we can create the boxplot with the help of Boxplot function of car package by defining the id.method.
For example, if we have a vector called V then the boxplot of V with highlighted outliers can be created by using the below given command −
Boxplot(~V,id.method="y")
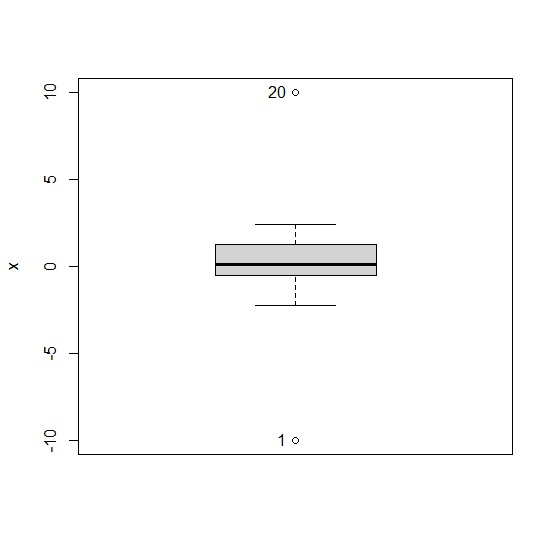
Example 1
To highlight outliers in a boxplot, use the command given below −
library(car)
x<-c(-10,rnorm(18),10)
Boxplot(~x,id.method="y")
[1] "1" "20"
Output
If you execute all the above given snippets as a single program, it generates the following output −
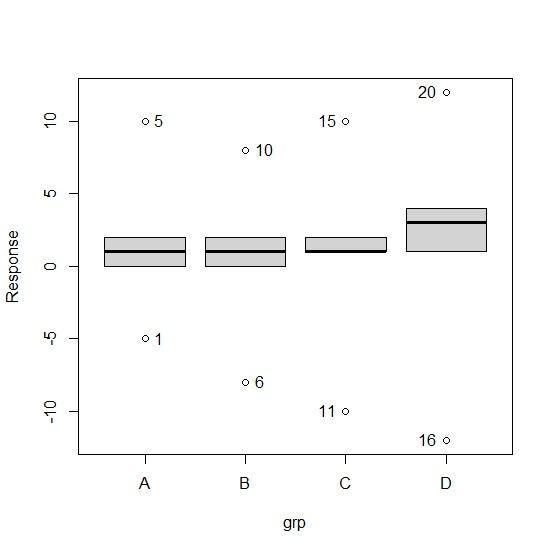
Example 2
To highlight outliers in a boxplot, use the command given below −
grp<-rep(LETTERS[1:4],each=5)
Response<-c(-5,rpois(3,1),10,-8,rpois(3,2),8,-10,rpois(3,2),10,-12,rpois(3,3),12)
Boxplot(Response~grp,id.method="y")
[1] "1" "5" "6" "10" "11" "15" "16" "20"
Warning message
In Boxplot.default(mf[[response]], x, id = list(method = id.method, −
NAs introduced by coercion
This warning message is displayed because format of the values might not be proper in Response vector but it does not make an impact on the boxplots so we can ignore it.
Output
If you execute all the above given snippets as a single program, it generates the following output −

797 Views
