
Article Categories
- All Categories
-
 Data Structure
-
 Networking
-
 RDBMS
RDBMS
-
 Operating System
-
 Java
Java
-
 MS Excel
-
 iOS
iOS
-
 HTML
HTML
-
 CSS
CSS
-
 Android
-
 Python
-
 C Programming
-
 C++
C++
-
 C#
C#
-
 MongoDB
-
 MySQL
MySQL
-
 Javascript
-
 PHP
PHP
-
 Economics & Finance
Selected Reading
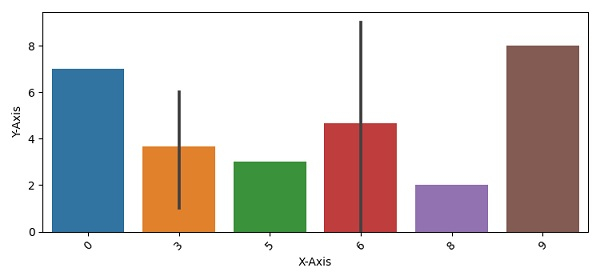
Rotate tick labels for Seaborn barplot in Matplotib
To rotate tick labels for Seaborn barplot, we can take the following steps −
Make a dataframe using Pandas.
Plot the bar using Seaborn's barplot() method.
Rotate the xticks label by 45 angle.
To display the figure, use the show() method.
Example
import pandas
import matplotlib.pylab as plt
import seaborn as sns
import numpy as np
plt.rcParams["figure.figsize"] = [7.50, 3.50]
plt.rcParams["figure.autolayout"] = True
df = pandas.DataFrame({"X-Axis": [np.random.randint(10) for i in range(10)], "YAxis": [i for i in range(10)]})
bar_plot = sns.barplot(x='X-Axis', y='Y-Axis', data=df)
plt.xticks(rotation=45)
plt.show()
Output

Updated on: 2021-04-10T07:51:59+05:30
8K+ Views

Advertisements