 Data Structure
 Networking
 RDBMS
RDBMS Operating System
 Java
Java MS Excel
 iOS
iOS HTML
HTML CSS
CSS Android
 Python
 C Programming
 C++
C++ C#
C# MongoDB
 MySQL
MySQL Javascript
 PHP
PHP
- Selected Reading
- UPSC IAS Exams Notes
- Developer's Best Practices
- Questions and Answers
- Effective Resume Writing
- HR Interview Questions
- Computer Glossary
- Who is Who
Highlight the negative values red and positive values black in Pandas Dataframe
Analyzing data is a fundamental aspect of any data science or analytics task, one common requirement during data exploration is to quickly identify negative and positive values in a pandas dataframe for effective interpretation.
In this article, we will explore a powerful technique using the Pandas library in Python to visually highlight negative values in red and positive values in black within a DataFrame. By employing this approach, data analysts and researchers can efficiently distinguish between positive and negative trends, aiding in insightful data interpretation and decision-making.
How to highlight the negative values in red and positive values in black in Pandas Dataframe?
There are several methods to highlight negative values in red and positive values in black within a Pandas DataFrame. Here are three commonly used techniques
Method 1:Using Styler and Styler.applymap()
The Styler class in Pandas allows us to apply formatting to DataFrame elements. We can define a formatting function that checks the sign of each value and returns the appropriate CSS styles. Then, we can use the Styler.applymap() method to apply this function to each element of the DataFrame.
Method 2: Using Styler and Styler.background_gradient()
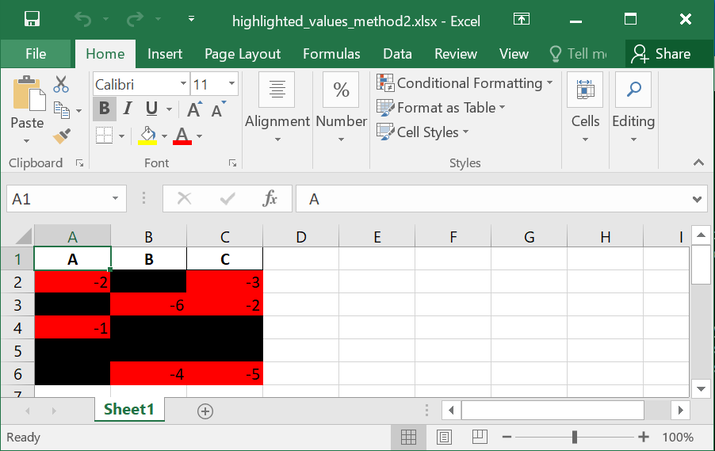
The Styler.background_gradient() method applies a gradient color map to the DataFrame based on the values. We can specify the color range, such as from red to black, and set the midpoint to zero. This method will assign colors automatically, with negative values appearing in red and positive values in black.
Method 3 : Using numpy.where()
We can use the numpy.where() function to create a new DataFrame where the values are replaced with color codes based on their sign. We can assign the color red to negative values and black to positive values. Then, we can display the DataFrame with the desired color formatting.
We will be using a program example to understand these methods, but first, let's look at the steps that we will follow
Import the necessary libraries ?
Pandas is imported to work with DataFrames.
numpy is imported to handle numerical calculations.
Define the formatting functions ?
The highlight_values function takes a value as input and returns the CSS style properties for formatting. It checks if the value is less than zero and returns 'color: red', otherwise 'color: black'.
The gradient_color function takes a data series as input and calculates the maximum value (norm) using the absolute values of the series. It then returns a list of CSS background color styles for each element in the series, assigning 'red' for negative values and 'black' for positive values.
The where_color function uses numpy.where() to create a new DataFrame where the values are replaced with color codes based on their sign. It assigns 'color: red' for negative values and 'color: black' for positive values.
Create a sample DataFrame ?
The program creates a sample DataFrame df with some numerical values.
Apply the formatting methods ?
Method 1: Using Styler and Styler.applymap()?
The DataFrame df is styled using df.style.
The applymap() method is applied to the styled DataFrame, and the highlight_values function is passed as an argument.
The resulting styled DataFrame is saved as an Excel file named highlighted_values_method1.xlsx.
Method 2: Using Styler and Styler.background_gradient() ?
The DataFrame df is styled using df.style.
The apply() method is applied to the styled DataFrame, and the gradient_color function is passed as an argument.
The resulting styled DataFrame is saved as an Excel file named highlighted_values_method2.xlsx.
Method 3: Using numpy.where() ?
The DataFrame df is styled using df.style.
The apply() method is applied to the styled DataFrame, and the where_color function is passed as an argument.
The resulting styled DataFrame is saved as an Excel file named highlighted_values_method3.xlsx.
Example
import pandas as pd
import numpy as np

# Method 1: Using Styler and Styler.applymap()
def highlight_values(x):
   if x < 0:
      return 'color: red'
   else:
      return 'color: black'

# Method 2: Using Styler and Styler.background_gradient()
def gradient_color(data):
   norm = abs(data.values).max()
   return ['background-color: {0}'.format('red' if x < 0 else 'black') for x in data]

# Method 3: Using numpy.where()
def where_color(df):
   return np.where(df < 0, 'color: red', 'color: black')

# Create a sample DataFrame
data = {'A': [-2, 4, -1, 5, 0],
   'B': [3, -6, 2, 7, -4],
   'C': [-3, -2, 1, 6, -5]}
df = pd.DataFrame(data)

# Method 1: Using Styler and Styler.applymap()
styled_df = df.style.applymap(highlight_values)
styled_df.to_excel('highlighted_values_method1.xlsx', engine='openpyxl', index=False)

# Method 2: Using Styler and Styler.background_gradient()
styled_df = df.style.apply(gradient_color)
styled_df.to_excel('highlighted_values_method2.xlsx', engine='openpyxl', index=False)

# Method 3: Using numpy.where()
styled_df = df.style.apply(where_color)
styled_df.to_excel('highlighted_values_method3.xlsx', engine='openpyxl', index=False)
Output
highlighted_values_method1.xlsx ?
A	B	C
-2	3	-3
4	-6	-2
-1	2	1
5	7	6
0	-4	-5
'highlighted_values_method2.xlsx ?

highlighted_values_method3.xlsx ?
A	B	C
-2	3	-3
4	-6	-2
-1	2	1
5	7	6
0	-4	-5
Conclusion
In conclusion, using various techniques in Pandas, such as the Styler class and numpy.where(), we can easily highlight negative values in red and positive values in black within a DataFrame. These methods provide effective ways to visually interpret data and identify trends or anomalies.

