 Data Structure
 Networking
 RDBMS
RDBMS Operating System
 Java
Java MS Excel
 iOS
iOS HTML
HTML CSS
CSS Android
 Python
 C Programming
 C++
C++ C#
C# MongoDB
 MySQL
MySQL Javascript
 PHP
PHP
- Selected Reading
- UPSC IAS Exams Notes
- Developer's Best Practices
- Questions and Answers
- Effective Resume Writing
- HR Interview Questions
- Computer Glossary
- Who is Who
Highlight the NaN values in Pandas Dataframe
Working with incomplete or missing data is a common challenge in data analysis, and the initial step towards addressing this problem is to identify the nan(missing) values in the data structute like a pandas dataframe. In a Pandas DataFrame, these missing values are often represented as NaN (Not a Number) values, which can occur due to various reasons like errors during data entry, extraction, or processing. However, detecting and pinpointing these NaN values can be quite difficult, particularly when dealing with extensive datasets.
Fortunately, Pandas offers a range of effective techniques for detecting and managing missing values. This article will explore multiple approaches to identify NaN values within a Pandas DataFrame, including utilizing built-in functions like isna(), notna(), and info(), as well as employing advanced methods like heatmap visualization for missing data.
How to Highlight the NaN values in Pandas Dataframe?
To identify NaN values in a Pandas DataFrame, we can employ various approaches through built-in functions and advanced methods. Let's delve into the details of these techniques ?
Built-in Functions
Method 1: isna()
This function returns a DataFrame of the same shape as the input, where each element is True if it is a NaN value and False otherwise. You can use this function to identify the locations of missing values.
The isna() function returns a DataFrame of the same shape as the input, where each element is marked as True if it is a NaN value and False otherwise. You can use this function to identify the locations of missing values.
Example
import pandas as pd

# Creating a sample DataFrame
data = {'Column1': [1, 2, None, 4, 5], 'Column2': [6, None, 8, 9, 10]}
df = pd.DataFrame(data)

# Using isna() to identify NaN values
nan_df = df.isna()
print(nan_df)
Output
    Column1  Column2
0    False    False
1    False     True
2     True    False
3    False    False
4    False    False
In the resulting DataFrame, True values indicate the presence of missing values, while False values indicate non-missing values or NaN.
Method 2: notna()
Similar to isna(), this function also returns a DataFrame with the same shape. However, it marks each element as True if it is not a NaN value and False if it is a missing value.
To apply notna(), you can simply call it on a DataFrame or a specific column. The resulting DataFrame will have the same shape as the original, with True values indicating non-missing values and False values indicating missing values.
Example
import pandas as pd

# Creating a sample DataFrame
data = {'Column1': [1, 2, None, 4, 5], 'Column2': [6, None, 8, 9, 10]}
df = pd.DataFrame(data)
# Using notna() to identify non-NaN values
notnan_df = df.notna()
print(notnan_df)
Output
Column1  Column2
0     True     True
1     True    False
2    False     True
3     True     True
4     True     True
In the resulting DataFrame, True values indicate the presence of non-missing values, while False values indicate missing values or NaN. This method is useful for filtering, conditional operations, or checking the completeness of data in a Pandas DataFrame.
Method 3: info()
This method provides a summary of the DataFrame, including the number of non-null values in each column. By examining this summary, you can easily identify columns with missing values. The columns with a lower count of non-null values indicate the presence of NaN values.
Example
import pandas as pd

# Creating a sample DataFrame
data = {'Column1': [1, 2, None, 4, 5], 'Column2': [6, None, 8, 9, 10]}
df = pd.DataFrame(data)
# Using info() to get the summary
df.info()
Output
RangeIndex: 5 entries, 0 to 4
Data columns (total 2 columns):
 #   Column   Non-Null Count  Dtype
---  ------   --------------  -----
 0   Column1  4 non-null      float64
 1   Column2  4 non-null      float64
dtypes: float64(2)
memory usage: 208.0 bytes
The output provides information about the DataFrame, such as the total number of rows (5), the column names ('Column1' and 'Column2'), the count of non-null values (4 for both columns), and the data types (float64). This summary helps to identify columns with missing values by comparing the non-null count with the total number of rows.
Advanced Methods
Method 4: Heatmap Visualization
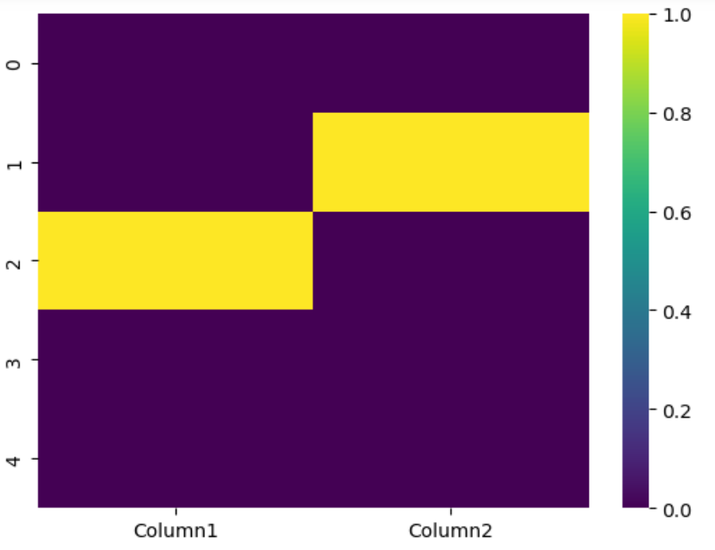
By visualizing missing data with a heatmap, you can gain a comprehensive overview of the distribution of missing values across the DataFrame. Heatmaps use color gradients to represent the presence or absence of NaN values in each cell, allowing you to identify patterns or clusters of missing data.
Example
import pandas as pd

# Creating a sample DataFrame
data = {'Column1': [1, 2, None, 4, 5], 'Column2': [6, None, 8, 9, 10]}
df = pd.DataFrame(data)
import matplotlib.pyplot as plt
import seaborn as sns

# Creating a heatmap of missing values
sns.heatmap(df.isna(), cmap='viridis')
plt.show()
Output

The resulting heatmap visualizes the distribution of missing values in the DataFrame. Yellow cells indicate the presence of missing values (NaN), allowing you to identify patterns or clusters of missing data across columns and rows. This visualization helps in understanding the extent and locations of missing values in the dataset.
Conclusion
In conclusion, identifying and highlighting NaN values in a Pandas DataFrame is crucial for data analysis. By utilizing built-in functions like isna() and notna(), along with advanced methods like heatmap visualization, we can effectively detect and visualize missing data, enabling accurate data handling and informed decision-making.

