 Data Structure
 Networking
 RDBMS
RDBMS Operating System
 Java
Java MS Excel
 iOS
iOS HTML
HTML CSS
CSS Android
 Python
 C Programming
 C++
C++ C#
C# MongoDB
 MySQL
MySQL Javascript
 PHP
PHP
- Selected Reading
- UPSC IAS Exams Notes
- Developer's Best Practices
- Questions and Answers
- Effective Resume Writing
- HR Interview Questions
- Computer Glossary
- Who is Who
Highlight the minimum value in each column In Pandas
Pandas, a widely utilized Python library for data manipulation, is commonly employed for tasks related to data analysis and preprocessing, a frequent need in data analysis involves determining and highlighing the minimum value within each column of a DataFrame. This information serves multiple purposes, including outlier identification, detection of data quality problems, and exploration of data distribution.
In this article, we will discover techniques for highlighting the minimum value in each column of a Pandas DataFrame, employing a range of Pandas functions and visualization methods.
How to highlight the minimum value in each column In Pandas?
There are several methods in Pandas to highlight the minimum value in each column of a DataFrame. Below are the three methods that are used for the purpose of Highlight the minimum value in each column in Pandas.
Method 1: Using the style.highlight_min() method
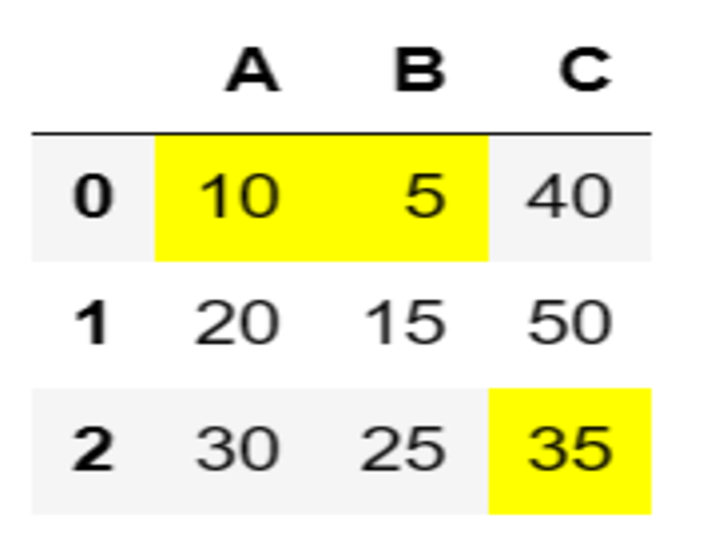
The style.highlight_min() function provides a straightforward approach to emphasize the minimum value in each column of a Pandas DataFrame. By default, it applies a yellow background to the minimum value in each column. The resulting DataFrame with highlighted values can be conveniently displayed in Jupyter Notebook or exported to different file formats. This method is effortless and efficient, serving as a valuable choice for swiftly identifying the minimum values in each DataFrame column.
Example
import pandas as pd
# Create a sample DataFrame
data = {'A': [10, 20, 30],
   'B': [5, 15, 25],
   'C': [40, 50, 35]}
df = pd.DataFrame(data)

# Highlight minimum values in each column
highlighted_df = df.style.highlight_min()

# Display the highlighted DataFrame
highlighted_df
Output

Method 2: Using a custom function with style.apply()
In Pandas, the style.apply() method lets you apply your own custom function to highlight specific elements in a DataFrame. By creating a function that can identify the minimum value in each column, you can apply your desired styling to those particular cells. This function compares each value with the minimum value and applies specific formatting, like changing the background color, to highlight the minimum value. This method grants you the freedom and control to tailor the highlighting of minimum values according to your specific needs and preferences.
Example
import pandas as pd

# Create a sample DataFrame
data = {'A': [10, 20, 30],
   'B': [5, 15, 25],
   'C': [40, 50, 35]}
df = pd.DataFrame(data)

# Define a function to highlight minimum value
def highlight_min(x):
   min_val = x.min()
   return ['background-color: yellow' if val == min_val else '' for val in x]

# Apply the function to the DataFrame
highlighted_df = df.style.apply(highlight_min)

# Display the highlighted DataFrame
highlighted_df
Output

Method 3: Using the style.background_gradient() method
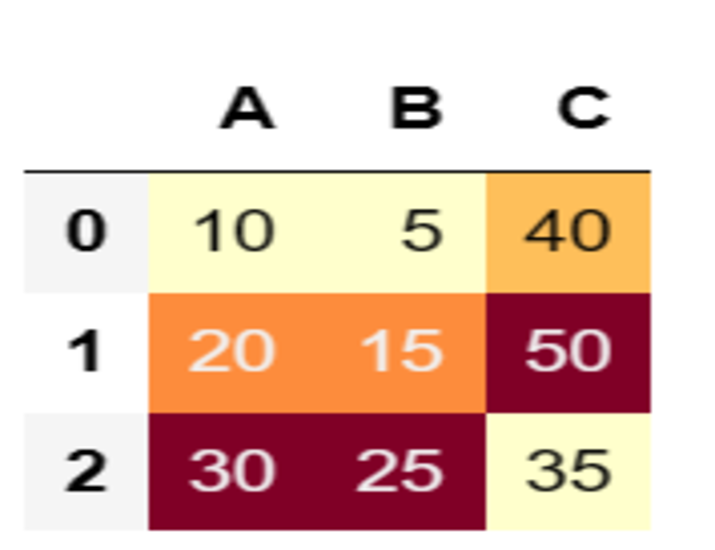
In Pandas, the style.background_gradient() function allows you to add a color gradient to a DataFrame based on the values in each cell. By default, the gradient is applied to the entire DataFrame, but you can choose to apply it to specific columns or rows if needed. The gradient assigns different colors to represent the range of values, where lower values are associated with one color and higher values with another. This approach is valuable for visually emphasizing the distribution of values in a DataFrame, facilitating the identification of patterns or discrepancies across columns or rows.
Example
import pandas as pd
# Create a sample DataFrame
data = {'A': [10, 20, 30],
   'B': [5, 15, 25],
   'C': [40, 50, 35]}
df = pd.DataFrame(data)

# Highlight minimum values using a gradient
highlighted_df = df.style.background_gradient(subset=pd.IndexSlice[:, :], cmap='YlOrRd')

# Display the highlighted DataFrame
highlighted_df
Output

These methods allow us to visually identify the minimum values in each column of a Pandas DataFrame. We can choose the method that suits your needs and preferences for highlighting the minimum values in the data.
Conclusion
In conclusion, highlighting the minimum value in each column of a Pandas DataFrame is a valuable technique in data analysis. By employing methods such asstyle.highlight_min(), style.apply(),and style.background_gradient(), we can easily identify and visually emphasize these minimum values. This enables us to detect outliers, identify data quality issues, and gain insights into the distribution of data.
With Pandas' flexibility and functionality, analysts have multiple options to customize the highlighting process based on their specific requirements. This article has provided practical examples and techniques to effectively highlight minimum values in Pandas, empowering analysts in their data exploration and analysis tasks.

