 Data Structure
 Networking
 RDBMS
RDBMS Operating System
 Java
Java MS Excel
 iOS
iOS HTML
HTML CSS
CSS Android
 Python
 C Programming
 C++
C++ C#
C# MongoDB
 MySQL
MySQL Javascript
 PHP
PHP
- Selected Reading
- UPSC IAS Exams Notes
- Developer's Best Practices
- Questions and Answers
- Effective Resume Writing
- HR Interview Questions
- Computer Glossary
- Who is Who
Forecasting Using ARIMA Models in Python
ARIMA is a statistical model used for time series forecasting that combines three components: autoregression (AR), integration (I), and moving average (MA).
Autoregression (AR) This component models the dependence between an observation and a number of lagged observations. It's based on the idea that past values of a time series can be used to predict future values. The order of autoregression, denoted by "p", specifies the number of lagged observations to use as predictors.
Integration (I) This component handles non-stationarity of the time series data by removing trends and seasonality. The order of integration, denoted by "d", is the number of times the original time series data needs to be differenced to make it stationary, i.e., to eliminate trend and seasonality.
Moving Average (MA) This component models the dependence between the residual errors of the time series after AR and I components have been applied. The order of moving average, denoted by "q", specifies the number of lagged residual errors to use as predictors.
The general form of an ARIMA model is ARIMA (p, d, q), where p, d, and q are the order of autoregression, integration, and moving average, respectively. To use an ARIMA model for forecasting, one must first determine the values of p, d, and q that best fit the data. This can be done through a process known as model selection, which involves fitting various ARIMA models with different combinations of p, d, and q and selecting the model with the lowest error.
Forecasting Sales of next 12 months
Forecasting sales using ARIMA is a process of using statistical techniques to predict future sales of a company based on its historical sales data. The process usually takes place in the following steps:
Collecting historical sales data and transforming it into a time series format.
Visualizing the data to identify any trends, seasonality, or patterns.
Determining the order of differencing required to make the time series stationary.
Selecting the order of the ARIMA model (p, d, q) based on the patterns in the data.
Fitting an ARIMA model to the data and making predictions for future sales.
Evaluating the performance of the model and making adjustments as needed.
Using the model to make predictions for future sales and making decisions based on the predictions.
ARIMA is a popular method for sales forecasting as it can capture complex patterns in the data and handle both trends and seasonality in the time series. However, the performance of the model can be impacted by various factors such as the quality of the data, the choice of parameters, and the ability of the model to capture the underlying patterns in the data.
Let us now see an example of forecasting with ARIMA.
The dataset (sales_data.csv) used below is available here.
Example
import pandas as pd
import numpy as np
import statsmodels.api as sm
import matplotlib.pyplot as plt

# Load the time series data
data = pd.read_csv('sales_data.csv')

# Fit the ARIMA model
model = sm.tsa.ARIMA(data['sales'], order=(2, 1, 1))
model_fit = model.fit()

# Forecast future values
forecast = model_fit.forecast(steps=12)

# Print the forecast
print(forecast[0])

# Plot the time series
data2=np.append(data,forecast[0])
plt.plot(data2)
plt.xlabel('Date')
plt.ylabel('Sales')
plt.title('Synthetic Time Series Data')
plt.show()
Output
[56.29545598 56.60345925 56.90298063 57.19449608 57.47839568 57.7550522
 58.02482013 58.28803659 58.54502221 58.79608193 59.04150576 59.28156952]

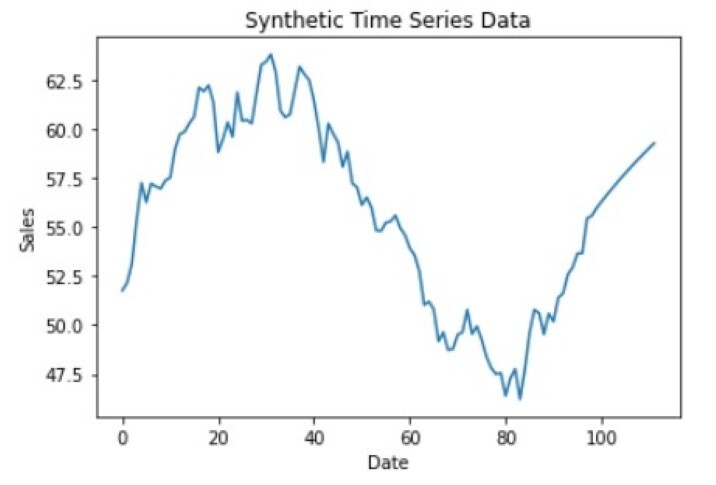
In this example, the time series data is the sales data for a particular product, loaded from a CSV file into a pandas dataframe. The ARIMA model is fit to the sales data using the sm.tsa.ARIMA function, with the order of autoregression set to 2, the order of integration set to 1, and the order of moving average set to 1.
The model_fit object is then used to generate a forecast of future sales, using the forecast method with a steps argument of 12 to specify the number of future values to be forecasted. The forecast is then printed, which gives the expected sales values for the next 12 months.
Custom Datasets
In this we will be defining the dataset in the code itself. The data will initially be in the form of a list and later be converted to a Pandas Data frame.
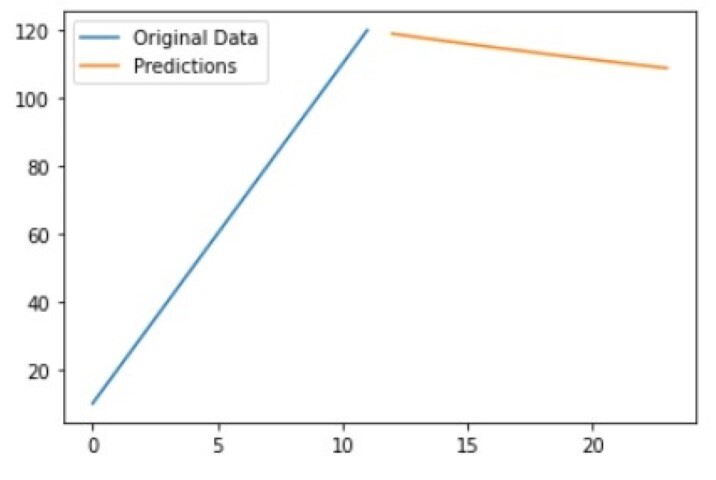
This code then fits an ARIMA model to the custom dataset, makes predictions for the next 12 time steps, and stores the predictions in the predictions variable. In this example, the custom dataset is a list of 12 values, but the process for fitting an ARIMA model and making predictions would be the same for any time series data.
Example
import numpy as np
import pandas as pd
import matplotlib.pyplot as plt
from statsmodels.tsa.arima.model import ARIMA

# Load custom dataset
data = [10, 20, 30, 40, 50, 60, 70, 80, 90, 100, 110, 120]

# Convert data to a pandas DataFrame
df = pd.DataFrame({'values': data})

# Fit the ARIMA model
model = ARIMA(df['values'], order=(1,0,0))
model_fit = model.fit()

# Make predictions
predictions = model_fit.forecast(steps=12)
print(predictions)
# Plot the original dataset and predictions
plt.plot(df['values'], label='Original Data')
plt.plot(predictions, label='Predictions')
plt.legend()
plt.show()
Output
12   118.967858
13   117.955086
14   116.961320
15   115.986203
16   115.029385
17   114.090523
18   113.169280
19   112.265326
20   111.378335
21   110.507989
22   109.653977
23   108.815991
Name: predicted_mean, dtype: float64

Boston Housing Dataset
import numpy as np
import pandas as pd
from statsmodels.tsa.arima.model import ARIMA
import matplotlib.pyplot as plt
from sklearn.datasets import load_boston
import warnings
warnings.filterwarnings("ignore")

# Load the Boston dataset
boston = load_boston()
data = boston.data

# Convert data to a pandas DataFrame
df = pd.DataFrame(data, columns=boston.feature_names)

df=df.head(20)
# Fit the ARIMA model
model = ARIMA(df['CRIM'], order=(1,0,0))
model_fit = model.fit()

# Make predictions
predictions = model_fit.forecast(steps=12)
print(predictions.tolist())
# Plot the original dataset and predictions
plt.plot(df['CRIM'], label='Original Data')
plt.plot(predictions, label='Predictions')
plt.legend()
plt.show()
Output
[0.6738187961066762, 0.6288621548198372, 0.5899808007068923,
0.5563537401796019, 0.5272709259231514, 0.5021182639951554,
0.4803646470141665, 0.46155073963886595, 0.44527927953934654,
0.4312066890620576, 0.41903582046573945, 0.40850968154143097]

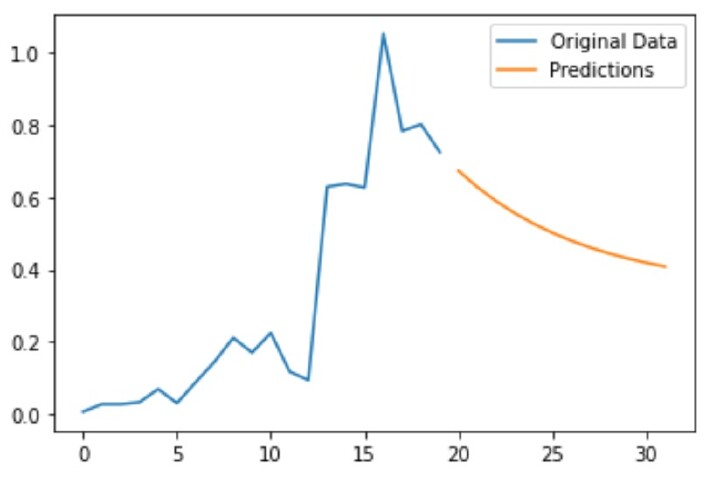
All X values in graphs are in the form of index values.
Conclusion
ARIMA is a powerful time series forecasting method that can be used to predict stock prices in Python. The process of forecasting with ARIMA involves transforming the time series data into a stationary format, determining the order of differencing, autoregressive, and moving average terms, fitting an ARIMA model to the data, generating predictions, and evaluating the performance of the model. The statsmodels library in Python provides a convenient and efficient way to perform ARIMA forecasting. However, it is important to keep in mind that ARIMA is only one of many methods available for stock price forecasting, and the results of the model may vary depending on the quality and characteristics of the data used.
