
Article Categories
- All Categories
-
 Data Structure
-
 Networking
-
 RDBMS
RDBMS
-
 Operating System
-
 Java
Java
-
 MS Excel
-
 iOS
iOS
-
 HTML
HTML
-
 CSS
CSS
-
 Android
-
 Python
-
 C Programming
-
 C++
C++
-
 C#
C#
-
 MongoDB
-
 MySQL
MySQL
-
 Javascript
-
 PHP
PHP
-
 Economics & Finance
Selected Reading
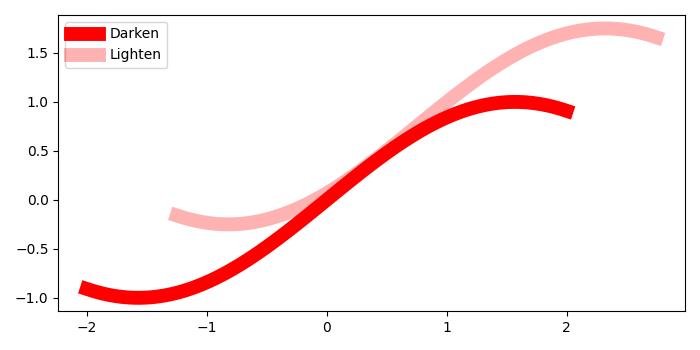
Darken or lighten a color in Matplotlib
To darken and lighten the color, we can chage the alpha value in the argument of plot() method.Greater the aplha value, darker will be the color.
Steps
- Create data points for xs and ys using numpy.
- Plot two lines with different value of alpha, to replicate darker and lighter color of the lines
- Place legend of the plot using legend() method.
- To display the figure, use show() method.
Example
import numpy as np
from matplotlib import pyplot as plt
plt.rcParams["figure.figsize"] = [7.00, 3.50]
plt.rcParams["figure.autolayout"] = True
xs = np.linspace(-2, 2, 100)
ys = np.sin(xs)
plt.plot(xs, ys, c='red', lw=10, label="Darken")
plt.plot(xs+.75, ys+.75, c='red', lw=10, alpha=0.3, label="Lighten")
plt.legend(loc='upper left')
plt.show()
Output

Updated on: 2021-05-06T13:36:30+05:30
6K+ Views

Advertisements