
Article Categories
- All Categories
-
 Data Structure
-
 Networking
-
 RDBMS
RDBMS
-
 Operating System
-
 Java
Java
-
 MS Excel
-
 iOS
iOS
-
 HTML
HTML
-
 CSS
CSS
-
 Android
-
 Python
-
 C Programming
-
 C++
C++
-
 C#
C#
-
 MongoDB
-
 MySQL
MySQL
-
 Javascript
-
 PHP
PHP
-
 Economics & Finance
Selected Reading
How to customize the color and colormaps of a Plot in Matplotlib
To customize the color and colormaps of a plot, we can use the colormap property from the color library. There are two types of colormap we can create: (a) discrete colormap and (b) continuous colormap.
We will first see how to create a discrete colormap followed by continuous colormap.
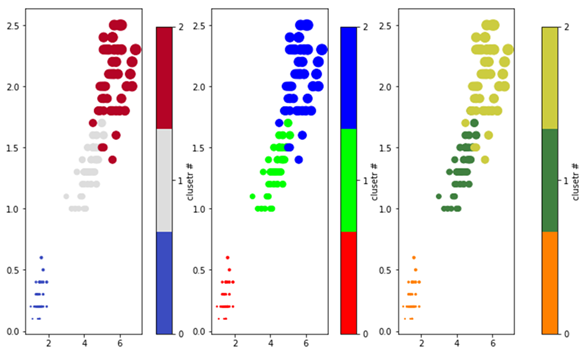
In the example, we will use ‘iris’ dataset to create three plots such that the first plot uses the default colormap and the other two uses RGB map to create a mixed colored plot. However, we can create as many color maps as we have clusters.
Example
import matplotlib.pyplot as plt
import pandas as pd
import numpy as np
from matplotlib.colors import LinearSegmentedColormap

#Reading the iris dataset
iris = pd.read_csv('iris_dataset.csv', delimiter=',')
iris['species'] = iris['species'].map({"setosa" : 0, "versicolor" :1, "virginica" : 2})

#Defining the figure and its layout
fig, axs = plt.subplots(1,3, figsize=(9,6))
fig.subplots_adjust(left=0.0, bottom=0.05, right=0.9, top=0.95, wspace=0.6)

#Function to plot the graph
def plot_graph(axes, cm, cbaxs):
im = axes.scatter(iris.petal_length, iris.petal_width, s=10*iris.petal_length*iris.petal_width, c=iris.species, cmap = cm)
caxs = plt.axes(cbaxs)
fig.colorbar(im, caxs, ticks=range(3), label='clusetr #')

#Plot the iris dataset clusters with colors chosen from colormap
cbaxs = [0.24, 0.05, 0.03, 0.85] # left, bottom, width and height
plot_graph(axs[0], plt.cm.get_cmap('coolwarm', 3), cbaxs)

#Plot the iris dataset with custom colors RGB
colors = [(1, 0, 0), (0, 1, 0), (0, 0, 1)]
cm = LinearSegmentedColormap.from_list('custom_RGB_cmap', colors,N=3)

#Plot the iris dataset clusters with custom mixed colormaps
cbaxs = [0.58, 0.05, 0.03, 0.85]
plot_graph(axs[1], cm, cbaxs)
colors = [(1, 0.5, 0), (0.25, 0.5, 0.25), (0, 0.5, 1)]
cm = LinearSegmentedColormap.from_list('dummy', colors, N=3)
cbaxs = [0.95, 0.05, 0.03, 0.85]
plot_graph(axs[2], cm, cbaxs)

#Display the plot
plt.show()
Output

Updated on: 2021-02-23T14:47:58+05:30
734 Views

Advertisements