
 Data Structure
 Networking
 RDBMS
RDBMS Operating System
 Java
Java MS Excel
 iOS
iOS HTML
HTML CSS
CSS Android
 Python
 C Programming
 C++
C++ C#
C# MongoDB
 MySQL
MySQL Javascript
 PHP
PHP
- Selected Reading
- UPSC IAS Exams Notes
- Developer's Best Practices
- Questions and Answers
- Effective Resume Writing
- HR Interview Questions
- Computer Glossary
- Who is Who
Create a Count Plot with SeaBorn – Python Pandas
Count Plot in Seaborn is used to display the counts of observations in each categorical bin using bars. The seaborn.countplot() is used for this.
Let’s say the following is our dataset in the form of a CSV file − Cricketers.csv
At first, import the required 3 libraries −
import seaborn as sb
import pandas as pd
import matplotlib.pyplot as plt
Load data from a CSV file into a Pandas DataFrame −
dataFrame = pd.read_csv("C:\Users\amit_\Desktop\Cricketers.csv")
Example
Following is the code −
import seaborn as sb
import pandas as pd
import matplotlib.pyplot as plt
# Load data from a CSV file into a Pandas DataFrame
dataFrame = pd.read_csv("C:\Users\amit_\Desktop\Cricketers.csv")
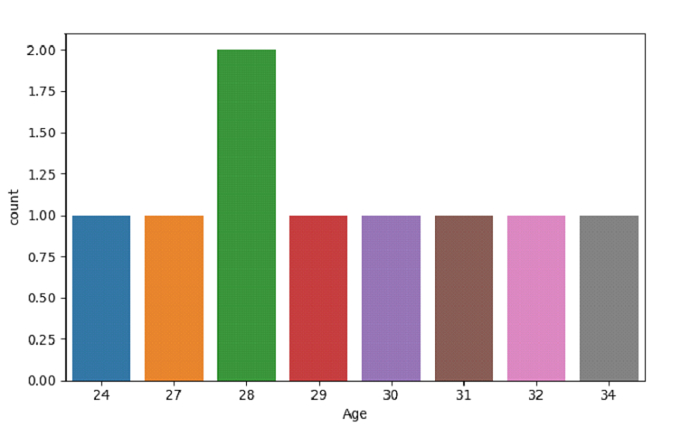
# plotting count plot with Age column
sb.countplot(dataFrame["Age"])
# display
plt.show()
Output
This will produce the following output −
Example
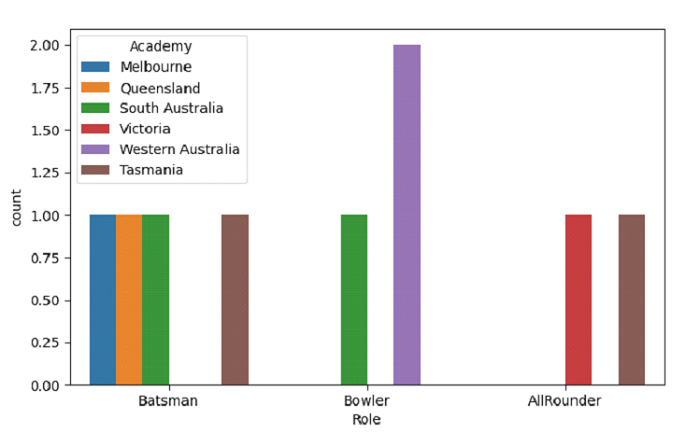
Let us see another example wherein we have used the hue parameter −
import seaborn as sb
import pandas as pd
import matplotlib.pyplot as plt

# Load data from a CSV file into a Pandas DataFrame
dataFrame = pd.read_csv("C:\Users\amit_\Desktop\Cricketers.csv")

# plotting count plot with Role column and hue as Academy
sb.countplot( x= "Role", hue="Academy", data=dataFrame)

# display
plt.show()
Output
This will produce the following output −

Updated on: 2021-10-01T12:37:16+05:30
1K+ Views

Advertisements