
Article Categories
- All Categories
-
 Data Structure
-
 Networking
-
 RDBMS
RDBMS
-
 Operating System
-
 Java
Java
-
 MS Excel
-
 iOS
iOS
-
 HTML
HTML
-
 CSS
CSS
-
 Android
-
 Python
-
 C Programming
-
 C++
C++
-
 C#
C#
-
 MongoDB
-
 MySQL
MySQL
-
 Javascript
-
 PHP
PHP
-
 Economics & Finance
Checking the normality of a data set or a feature
Introduction
Normality is defined as the phenomenon of belonging to a normal or Gaussian distribution in statistical terms. The normality of a dataset is the test for a dataset or variable if it follows a normal distribution. Many tests can be performed to check the normality of a dataset among which the most popular ones are the Histogram method, the QQ plot, and the KS Test.
Normality testing - Checking for Normality
There are both statistical and graphical approaches to determining the normality of a dataset or a feature. Let us look through some of these methods.
Graphical Methods
Histogram Plot
A histogram shows the distribution of features in the form of bar graphs. Each bar represents the frequency of occurrence of a particular value. It is used to visualize a single feature.
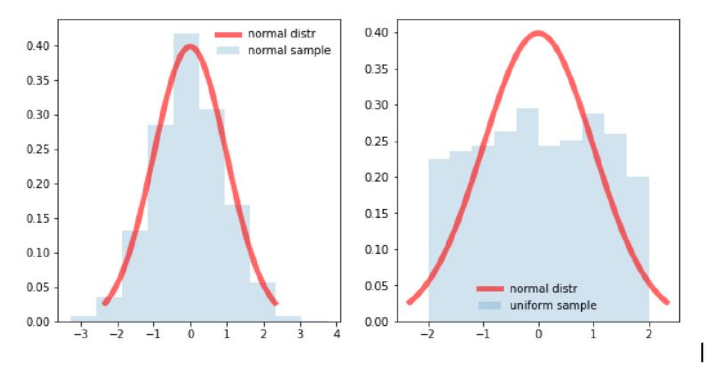
In the above two images, we can see that the left image follows a bell-shaped normal curve more closely that the image on the right side. Thus we can infer that the left image is a normal distribution.
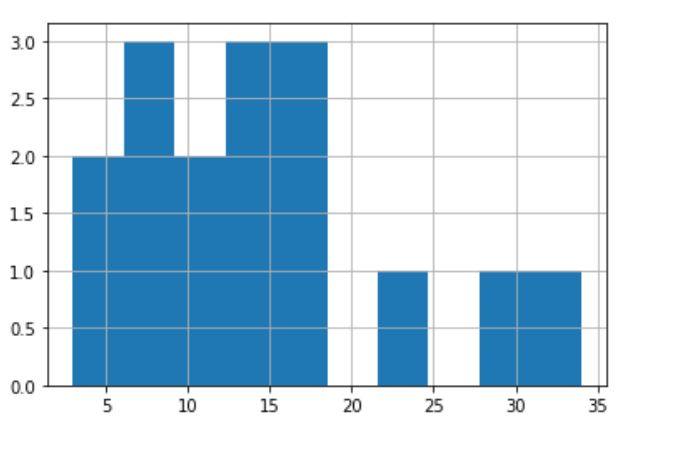
Code Sample [Histogram]
import pandas as pd
df = pd.Series([11,12,13,14,15,16,17,18,8,3,5,7,9,23,30,34])
df.hist()
Output
QQ Plot
Known as Quantile- Quantile plot show deviations from normal distribution more clearly as it plots the actual quantiles with the theoretical ones.
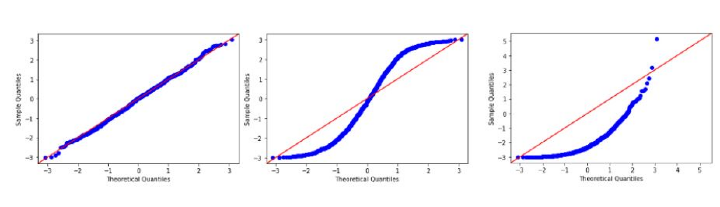
For the data or feature to follow a normal distribution it should align with a red line in the above diagrams/plots more closely. In the leftmost image, we can say it follows a normal distribution as the actual quantiles coincide with theoretical quantiles.
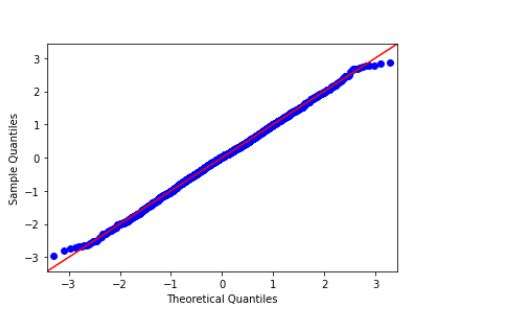
Sample Code [ QQ Plot ]
import statsmodels.api as sapi
from scipy.stats import norm as nm
import matplotlib.pyplot as plt

data = nm.rvs(size=2000)
sapi.qqplot(data, line='45')
plt.show()
Output
Statistical Methods
KS Test
The KS test stands for Kolmogorov Smirnov Test. It gives defines a test statistic by measuring the distances between empirical and theoretical distribution. In the KS test, the Kolmogorov Smirnov is the test statistic. We look for the null hypothesis to be true, then it follows the Kolmogorov distribution. P value can decide whether to accept or reject a null hypothesis. The value of the KS statistic should become 0 for the data to follow a normal distribution.
If the P value of the test is greater than 0.05 we conclude that the data follows a normal distribution and if the P value is smaller than 0.05 we consider a non-normal distribution.
The disadvantage of the KS test is that it requires a large number of data points to reject the null hypothesis. Outliers can affect the KS test.
Sample Code [ KS Test ]
from scipy.stats import norm,kstest
datapoints = norm.rvs(size=2000)
statks, pval = kstest(datapoints, 'norm')
print("statistics (KS) : ", statks,", pvalue : " ,pval)
Output
statistics (KS) : 0.021882913017164163 , pvalue : 0.2894024815418249
Shapiro Wilk test
It is a very powerful test of normality. It is also used for other distributions.
If the P value of the Wilk test is greater than 0.05 we conclude that the data follows a normal distribution and if the P value is smaller than 0.05 we consider a non-normal distribution.
Sample Code [ Wilk Test ]
from scipy.stats import shapiro,norm
datapoints = norm.rvs(size=1000)
statistic_val,pval = shapiro(datapoints)
print("statistic : ", statistic_val,",  pvalue : " ,pval)
Output
statistic : 0.9993162155151367 , pvalue : 0.9813627600669861
Conclusion
The normality of the dataset or feature is a highly desirable characteristic in data analysis. There are quite several good Normality tests including both Graphical and Statistical approaches. A normal dataset is considered to be standard in Machine Learning and Data Science since it holds useful information and data from most natural phenomena exhibit normality

689 Views
