
Article Categories
- All Categories
-
 Data Structure
-
 Networking
-
 RDBMS
RDBMS
-
 Operating System
-
 Java
Java
-
 MS Excel
-
 iOS
iOS
-
 HTML
HTML
-
 CSS
CSS
-
 Android
-
 Python
-
 C Programming
-
 C++
C++
-
 C#
C#
-
 MongoDB
-
 MySQL
MySQL
-
 Javascript
-
 PHP
PHP
-
 Economics & Finance
Balance Contrast Enhancement Technique in MATLAB
In digital image processing, the contrast enhancement is a crucial technique used to improve visual quality of an image. The contrast enhancement technique adjusts the intensities of pixels to increase the range of brightness levels and highlights the differences between bright and dark regions of the image.
MATLAB provides various contrast enhancement techniques, but in this article, we will confine our focus to understand the balance contrast enhancement technique, and will see its implementation in MATLAB programming.
What is Balance Contrast Enhancement?
In MATLAB, the balance contrast enhancement technique is a modern method to improve the contrast ratio of a digital image. This technique enhances both local and global contrast at the same time, providing a balance. Consequently, this technique provides high visual quality and improved interpretability.
The balance contrast enhancement technique is based on a parabolic function given below:
y = a * (x - b).^2 + c
Where, y is the output image, x is the input image, and a, b, and c are three coefficient derived from "minimum intensity value of output image", "maximum intensity value of the output image", and "mean value of the output image" respectively.
The following MATLAB program shows the implementation of "Balance Contrast Enhancement" technique in MATLAB.
Example
% MATLAB program to demonstrate the balance contrast enhancement technique.
% Read the input image that has to be enhanced
img = imread('https://www.tutorialspoint.com/assets/questions/media/14304-1687425236.jpg');
% Display the original input image
figure, subplot(1, 2, 1), imshow(img); title('Original Image');
% Convert the input image from 8-bit unsigned integer format to double format for processing
img1 = double(img);
% Calculate different statistics of the input image
Imin = min(img1(:)); 		% Minimum intensity value of input image
Imax = max(img1(:));		% Maximum intensity value of input image
Imean = mean(img1(:));		% Mean intensity value of input image
Imssum = mean(img1(:).^2);	% Mean square sum of intensity value of input image
% Define the desired characteristics of the output image
Omin = 0; % Minimum intensity value of output image
Omax = 255; % Maximum intensity value of output image
Omean = 120; % Mean intensity value of output image
% Calculate the numerator and denominator to compute the coefficient "b"
bnum = Imax.^2 * (Omean - Omin) - Imssum * (Omax - Omin) + Imin.^2 * (Omax - Omean);
bden = 2 * (Imax * (Omean - Omin) - Imean * (Omax - Omin) + Imin * (Omax - Omean));
% Compute the value of the coefficient "b"
b = bnum/bden;
% Calculate the coefficient "a" of the parabolic function
a = (Omax - Omin)/((Imax - Imin) * (Imax + Imin - 2 * b));
% Calculate the coefficient "c" of the parabolic function
c = Omin - a * (Imin - b).^2;
% Apply the parabolic function to the input image "img1" to obtain the output image "img2"
img2 = a * (img1 - b).^2 + c;
% convert the output image back to the 8-bit unsigned integer format
img2 = uint8(img2);
% Display the enhanced image with a title Enhanced Image
subplot(1,2, 2), imshow(img2); title('Enhanced Image');
Output
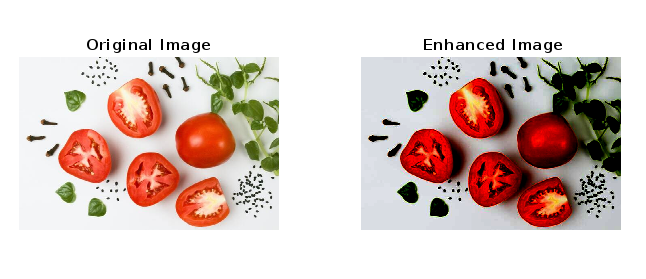
Conclusion
In this MATLAB program, we start by inputting an image by using the "imread" function and stores it in a variable "img". Next, we call "figure", "subplot", and "imshow" functions to display the original input image with the title "Original Image".
After that we covert the input image from 8-bit unsigned integer format to the floating point format to allow fractional calculations and stores this converted image in a new variable "img1", Then, we calculate different characteristics like minimum intensity (Imin), maximum intensity (Imax), mean intensity (Imean), and mean square sum of intensity (Imssum) of the input image.
Next, we specify various characteristics like minimum intensity (Omin), maximum intensity (Omax), and mean intensity (Omean) of the output image. Then, we compute the numerator (bnum), denominator (bden), and the coefficient b for the parabolic function.
After that we compute the values of coefficients "a" and "c" for the parabolic function. The, we put the values of parameters "a", "b", "c", "img1" in the parabolic function to obtain the output image "img2" from the input image "img1".
Finally, we display the enhanced output image by using "subplot", "imshow" functions with a title "Enhanced Image".
This is how we can implement the balance contrast enhancement technique for an image in MATLAB.

323 Views
