- Writing, Graphing and Solving Inequalities
- Home
- Translating a Sentence by Using an Inequality Symbol
- Translating a Sentence into a One-Step Inequality
- Introduction to Identifying Solutions to an Inequality
- Writing an Inequality for a Real-World Situation
- Graphing a Linear Inequality on the Number Line
- Writing an Inequality Given a Graph on the Number Line
- Identifying Solutions to a One-Step Linear Inequality
- Additive Property of Inequality with Whole Numbers
- Multiplicative Property of Inequality with Whole Numbers
- Solving a Two-Step Linear Inequality with Whole Numbers
- Solving a Word Problem Using a One-Step Linear Inequality
Graphing a Linear Inequality on the Number Line
Introduction
We represent inequalities by using a number line in this lesson.
In the examples below, we show the range of true values for a given inequality.
We use an open dot to represent < and > relationships; this symbol indicates that the point on the number line is not included within the range of possible values for the inequality.
We use a closed dot to represent ≤ and ≥, when the two sides of the inequality could be equal.
Number Line
We recall that a number line is a horizontal line that has points, which correspond to numbers. The points are spaced according to the value of the number they correspond to; the points are equally spaced in a number line containing only whole numbers or integers.
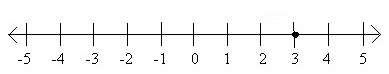
Graph of the point 3
We graph numbers by representing them as points on the number line. For example, we graph "3" on the number line as shown below −
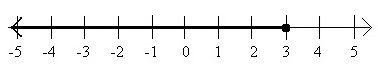
Graph of the Inequality x ≤ 3
We can also graph inequalities on the number line. The following graph represents the inequality x ≤ 3. The dark line represents all the numbers that satisfy x ≤ 3. If we pick any number on the dark line and plug it in for x, the inequality will be true.
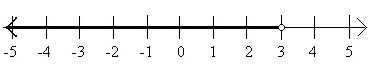
Graph of the Inequality x < 3
The following graph represents the inequality x < 3. Note that the open circle on 3 shows that 3 is not a solution to x < 3.
Graph of the Inequality x > 3
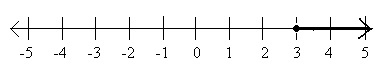
Here are the graphs of x > 3 and x ≥ 3, respectively
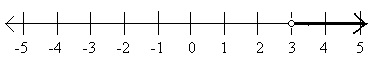
Graph of the Inequality x ≥ 3
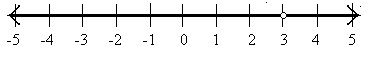
Graph of the Inequality x ≠ 3
An inequality with a ≠" sign has a solution set which is all the real numbers except a single point. Thus, to graph an inequality with a " ≠ " sign, graph the entire line with one point removed. For example, the graph of x ≠ 3 looks like −
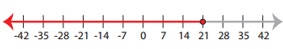
Example 1
Graph the following inequality on the number line −
$\frac{x}{3}$ ≤ 7
Solution
Step 1:
$\frac{x}{3}$ ≤ 7; x ≤ (7 × 3); x ≤ 21
We first locate the point 21 on the number line.
Step 2:
We put a closed circle on 21 and draw a thick line towards left to denote the inequality x ≤ 21
Example 2
Graph the following inequality on the number line −
x > 32
Solution
Step 1:
We first locate the point 32 on the number line.
Step 2:
We put a open circle on 32 and draw a thick line towards right to denote the inequality
x > 32