- Weka - Home
- Weka - Introduction
- What is Weka?
- Weka - Installation
- Weka - Launching Explorer
- Weka - Loading Data
- Weka - File Formats
- Weka - Preprocessing the Data
- Weka - Classifiers
- Weka - Clustering
- Weka - Association
- Weka - Feature Selection
- Weka Useful Resources
- Weka - Quick Guide
- Weka - Useful Resources
- Weka - Discussion
Weka - Clustering
A clustering algorithm finds groups of similar instances in the entire dataset. WEKA supports several clustering algorithms such as EM, FilteredClusterer, HierarchicalClusterer, SimpleKMeans and so on. You should understand these algorithms completely to fully exploit the WEKA capabilities.
As in the case of classification, WEKA allows you to visualize the detected clusters graphically. To demonstrate the clustering, we will use the provided iris database. The data set contains three classes of 50 instances each. Each class refers to a type of iris plant.
Loading Data
In the WEKA explorer select the Preprocess tab. Click on the Open file ... option and select the iris.arff file in the file selection dialog. When you load the data, the screen looks like as shown below −
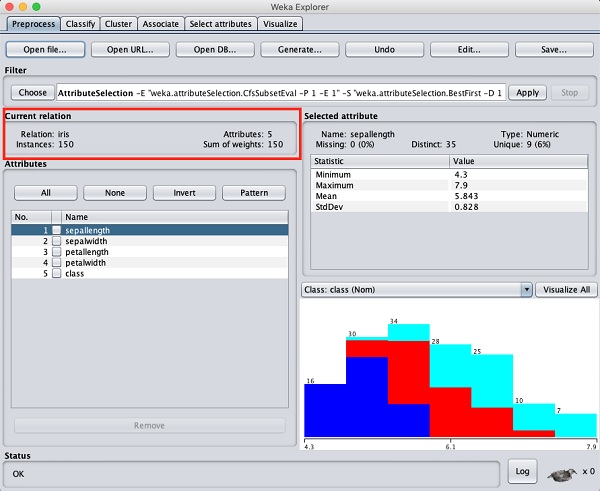
You can observe that there are 150 instances and 5 attributes. The names of attributes are listed as sepallength, sepalwidth, petallength, petalwidth and class. The first four attributes are of numeric type while the class is a nominal type with 3 distinct values. Examine each attribute to understand the features of the database. We will not do any preprocessing on this data and straight-away proceed to model building.
Clustering
Click on the Cluster TAB to apply the clustering algorithms to our loaded data. Click on the Choose button. You will see the following screen −
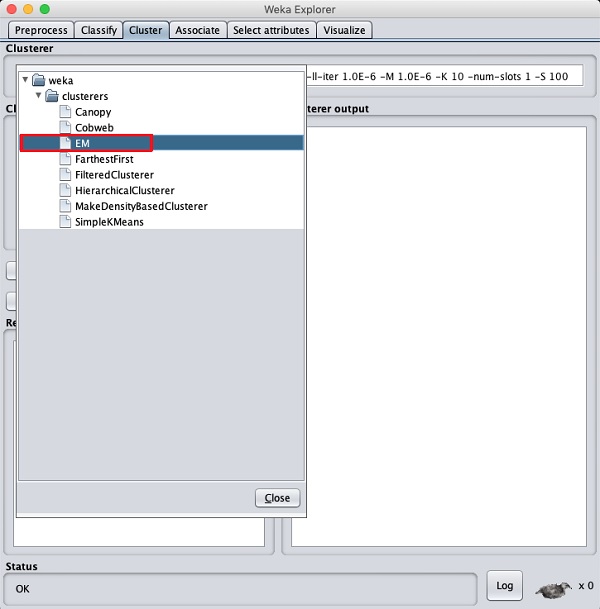
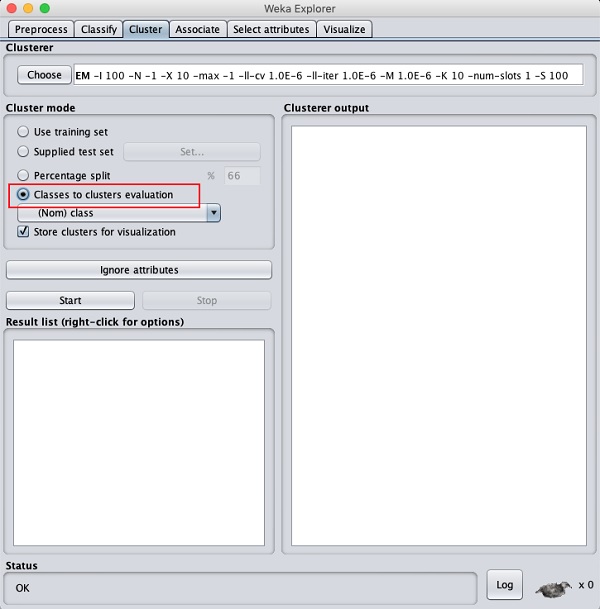
Now, select EM as the clustering algorithm. In the Cluster mode sub window, select the Classes to clusters evaluation option as shown in the screenshot below −
Click on the Start button to process the data. After a while, the results will be presented on the screen.
Next, let us study the results.
Examining Output
The output of the data processing is shown in the screen below −

From the output screen, you can observe that −
There are 5 clustered instances detected in the database.
The Cluster 0 represents setosa, Cluster 1 represents virginica, Cluster 2 represents versicolor, while the last two clusters do not have any class associated with them.
If you scroll up the output window, you will also see some statistics that gives the mean and standard deviation for each of the attributes in the various detected clusters. This is shown in the screenshot given below −
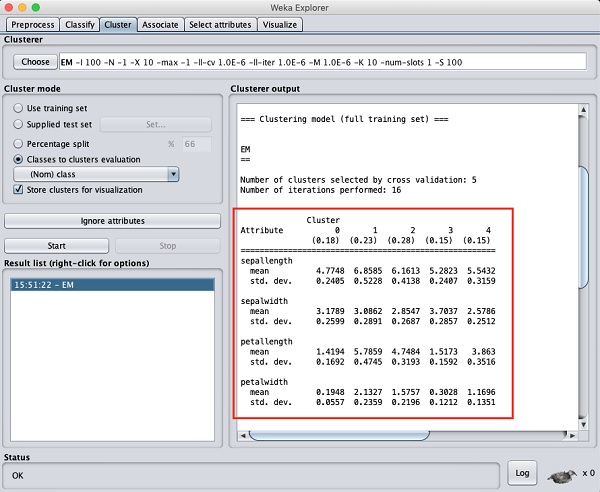
Next, we will look at the visual representation of the clusters.
Visualizing Clusters
To visualize the clusters, right click on the EM result in the Result list. You will see the following options −
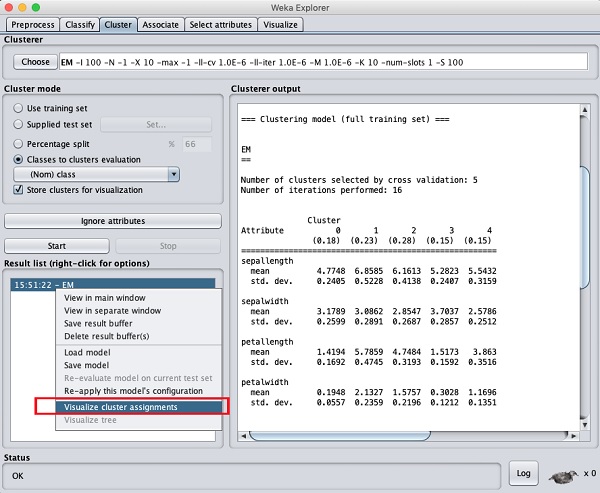
Select Visualize cluster assignments. You will see the following output −
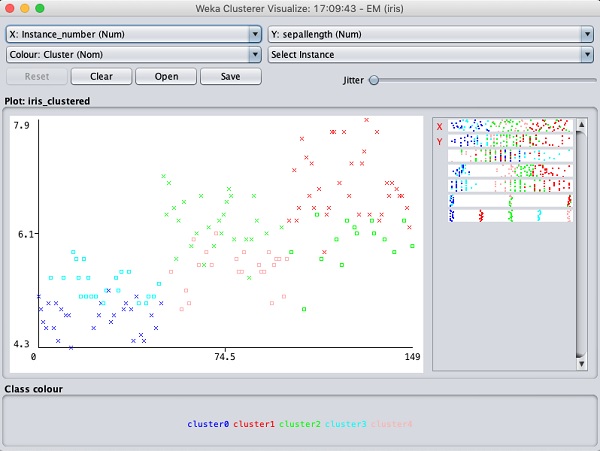
As in the case of classification, you will notice the distinction between the correctly and incorrectly identified instances. You can play around by changing the X and Y axes to analyze the results. You may use jittering as in the case of classification to find out the concentration of correctly identified instances. The operations in visualization plot are similar to the one you studied in the case of classification.
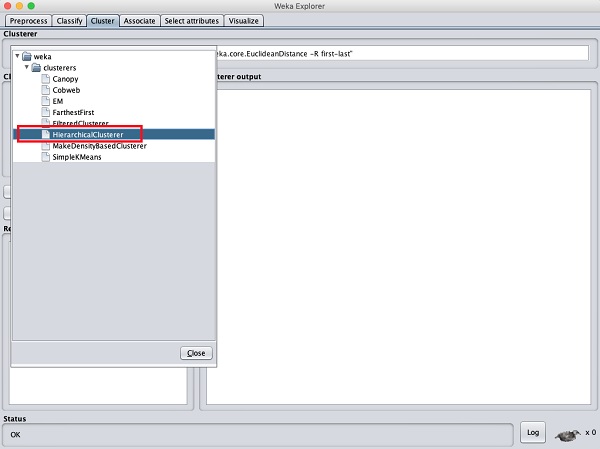
Applying Hierarchical Clusterer
To demonstrate the power of WEKA, let us now look into an application of another clustering algorithm. In the WEKA explorer, select the HierarchicalClusterer as your ML algorithm as shown in the screenshot shown below −
Choose the Cluster mode selection to Classes to cluster evaluation, and click on the Start button. You will see the following output −
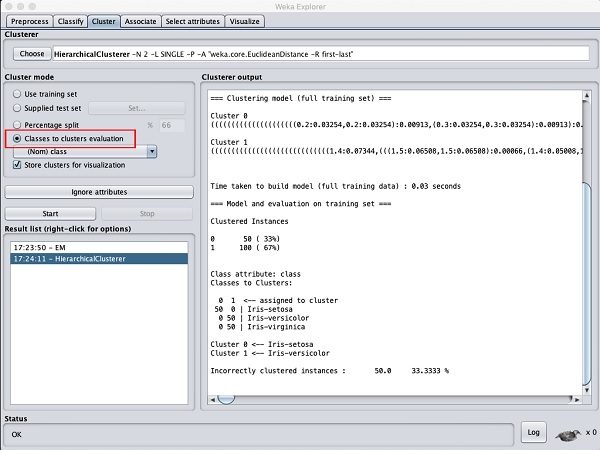
Notice that in the Result list, there are two results listed: the first one is the EM result and the second one is the current Hierarchical. Likewise, you can apply multiple ML algorithms to the same dataset and quickly compare their results.
If you examine the tree produced by this algorithm, you will see the following output −
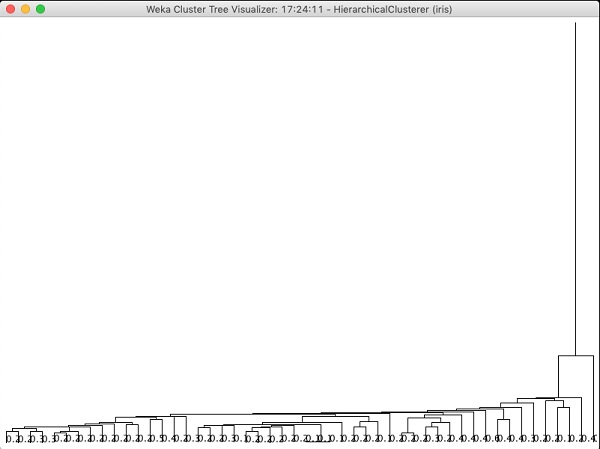
In the next chapter, you will study the Associate type of ML algorithms.
