
Article Categories
- All Categories
-
 Data Structure
-
 Networking
-
 RDBMS
RDBMS
-
 Operating System
-
 Java
Java
-
 MS Excel
-
 iOS
iOS
-
 HTML
HTML
-
 CSS
CSS
-
 Android
-
 Python
-
 C Programming
-
 C++
C++
-
 C#
C#
-
 MongoDB
-
 MySQL
MySQL
-
 Javascript
-
 PHP
PHP
-
 Economics & Finance
Up Sampling in Frequency Domain in MATLAB
Introduction to Up?Sampling
In digital signal processing, the technique which allows to increase the sampling rate of a signal is termed as up?sampling. For a signal expressed in frequency domain, the up sampling is performed by adding zeros in the frequency domain.
In digital signal processing, the up sampling in frequency domain is commonly used to interpolate or expand the bandwidth of a digital signal.
In MATLAB, the up?sampling process is completed in the following three phases:
Step 1 ? Perform Discrete Fourier Transformation (DFT)
In this phase/step, the given signal is transformed from the time domain to the frequency domain by performing the discrete Fourier transformation on it. In this process, the signal is decomposed into its elementary frequency components. This decomposed signal is expressed as a sum of complex exponential functions.
The DFT operation transforms a sequence of discrete samples or a digital signal into a sequence of complex numbers, known as a spectrum. The spectrum specifies the amplitude and phase of the frequency components of the signal.
Step 2 ? Perform Zero Padding
In this phase, some additional zeros are added to the signal represented in the frequency domain. This process is called zero padding. The zero padding increases the length of the spectrum by introducing new frequency terms. Thus, it increases the sampling rate and resolution of the signal.
Step 3 ? Perform Inverse Discrete Fourier Transformation (IDFT)
This step involves the inverse operation of the first step, i.e. discrete Fourier transformation. The inverse discrete Fourier transformation is performed to convert the frequency domain signal into the time domain signal to obtain the up?sampled signal in the time domain. This process reconstructs the original signal from its frequency components.
This is how we can perform up?sampling of a digital signal in the frequency domain using MATLAB to produce an up?sampled signal with higher sample rate and longer duration.
Up?sampling in frequency domain is widely used in digital signal processing, signal interpolation, signal resampling, etc.
Now, let us discuss consider a MATLAB program to perform up?sampling in frequency domain.
Example
% MATLAB program demonstrate the up-sampling in frequency domain
% Define the original sampling rate
f = 80;
% Create a time vector
t = 0:1/f:1;
% Define the original signal
a = cos(2*pi*50*t);
% Perform the DFT of the original signal
A = fft(a);
% Specify the up-sampling factor
uf = 2; 		% Adjust as per needs
% Perform zero-padding of the signal in the frequency-domain
upsampled_A = [A zeros(1, (uf-1)*length(A))];
% Perform the IDFT on the zero-padded signal to get the up-sampled signal in time domain
upsampled_a = ifft(upsampled_A);
% Perform the up-sampling of time vector
upsampled_t = 0:1/(f*uf):(1+(1/f)-(1/(f*uf)));
% Plot the original and up-sampled signals
figure;
subplot(2,1,1);
plot(t, a);
title('Original Signal');
xlabel('Time');
ylabel('Amplitude');
subplot(2,1,2);
plot(upsampled_t, upsampled_a);
title('Upsampled Signal');
xlabel('Time');
ylabel('Amplitude');
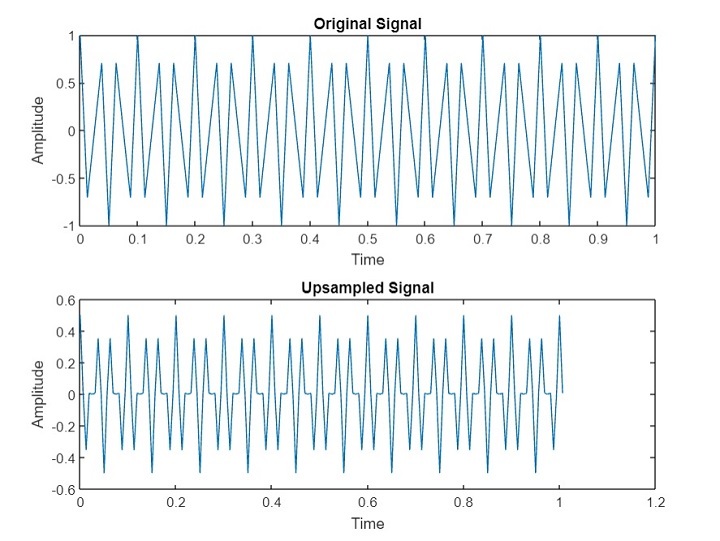
Output
Explanation
In this MATLAB code, we have demonstrated the process of up?sampling of a signal in frequency domain. In this program, we start by defining original sampling rate of the signal ?f?. Next, we create a time vector ?t? by using the frequency ?f?. This vector starts from 0 and goes up to 1, increasing by the rate ?1/f?.
After that we create the original signal ?a? which is a cosine signal of frequency ?50 Hz?. Then, we use the ?fft? function to perform the discrete Fourier transformation of the signal ?a? to obtain the complex spectrum ?A?. Next, we specify the up?sampling factor ?uf?. In this case, ?uf = 2? will up sample the signal by a factor 2.
Then, we perform zero?padding of the DFT signal ?A? to increase its length by adding additional zeros. After that we use the ?ifft? function to perform inverse discrete Fourier transformation of the up?sampled signal to convert it back to the time domain and store the result in the ?upsampled_a? variable.
Next, we perform up?sampling of the time vector ?t? and store the result in the ?upsampled_t? variable. This is done by increasing the original sampling rate by the up?sampling factor ?uf?.
Finally, we plot the original and up?sampled signals in two subplots in a figure with titles, ?Original Signal? and ?Upsampled Signal?.
Hence, this is how we can perform up?sampling of a given signal in the frequency domain by using MATLAB.

653 Views
