- Sublime Text - Home
- Sublime Text – Introduction
- Sublime Text – Installation
- Sublime Text – Data Directory
- Creating First Document
- Editing First Text Document
- Patterns of Code Editing
- Sublime Text – Sublime Linter
- Sublime Text – Shortcuts
- Sublime Text – Snippets
- Sublime Text – Macros
- Sublime Text – Key Bindings
- Sublime Text – Column Selection
- Sublime Text – Indentation
- Sublime Text – Base Settings
- Sublime Text – Theme Management
- Understanding Vintage Mode
- Sublime Text – Vintage Commands
- Sublime Text – Testing Javascript
- Sublime Text – Testing Python Code
- Sublime Text – Spell Check
- Sublime Text – Packages
- Sublime Text – Menus
- Sublime Text – Sub Menus of Font
- Sublime Text – Developing Plugin
- Sublime Text – Command Palette
- Debugging PHP Application
- Debugging Javascript Application
- Sublime Text – Batch Processing
- Distraction Free Mode
- SublimeCodeIntel Plugin
Debugging Javascript Application
Sublime Text Editor has a plugin Web Inspector for debugging JavaScript code. It helps us to set breakpoints, examine the console and evaluate sections of code. In this chapter, you will learn in detail about this plugin.
Installation of Sublime Web Inspector
The following steps show the installation of Sublime Web Inspector −
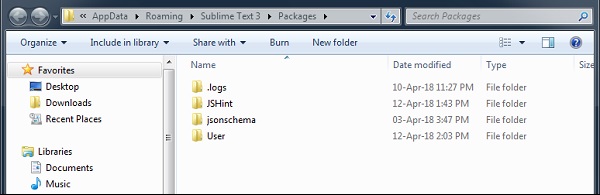
Step 1
Use the menu option Preferences → Browse Packages to get the path of installed packages as shown in the given screenshot.
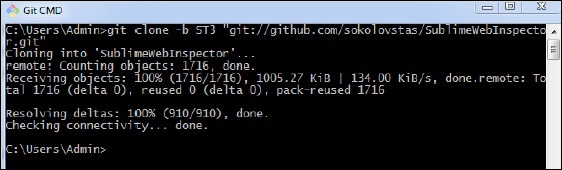
Step 2
With the help of git command prompt, clone the packages of Debugging Javascript web application using the git repository, as shown in the command given below −
git clone -b ST3 "git://github.com/sokolovstas/SublimeWebInspector.git"
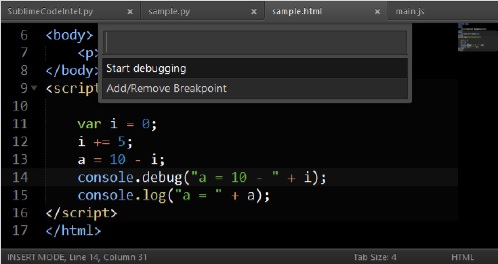
Step 3
To test the installation, open a command palette and start the web inspector. You can use the shortcut key for web inspector Ctrl+Shift+R on Windows and Cmd+Shift+R on OSX systems. You can see all the breakpoints needed for JavaScript application, as shown below −