- Matplotlib - Home
- Matplotlib - Introduction
- Matplotlib - Vs Seaborn
- Matplotlib - Environment Setup
- Matplotlib - Anaconda distribution
- Matplotlib - Jupyter Notebook
- Matplotlib - Pyplot API
- Matplotlib - Simple Plot
- Matplotlib - Saving Figures
- Matplotlib - Markers
- Matplotlib - Figures
- Matplotlib - Styles
- Matplotlib - Legends
- Matplotlib - Colors
- Matplotlib - Colormaps
- Matplotlib - Colormap Normalization
- Matplotlib - Choosing Colormaps
- Matplotlib - Colorbars
- Matplotlib - Working With Text
- Matplotlib - Text properties
- Matplotlib - Subplot Titles
- Matplotlib - Images
- Matplotlib - Image Masking
- Matplotlib - Annotations
- Matplotlib - Arrows
- Matplotlib - Fonts
- Matplotlib - Font Indexing
- Matplotlib - Font Properties
- Matplotlib - Scales
- Matplotlib - LaTeX
- Matplotlib - LaTeX Text Formatting in Annotations
- Matplotlib - PostScript
- Matplotlib - Mathematical Expressions
- Matplotlib - Animations
- Matplotlib - Celluloid Library
- Matplotlib - Blitting
- Matplotlib - Toolkits
- Matplotlib - Artists
- Matplotlib - Styling with Cycler
- Matplotlib - Paths
- Matplotlib - Path Effects
- Matplotlib - Transforms
- Matplotlib - Ticks and Tick Labels
- Matplotlib - Radian Ticks
- Matplotlib - Dateticks
- Matplotlib - Tick Formatters
- Matplotlib - Tick Locators
- Matplotlib - Basic Units
- Matplotlib - Autoscaling
- Matplotlib - Reverse Axes
- Matplotlib - Logarithmic Axes
- Matplotlib - Symlog
- Matplotlib - Unit Handling
- Matplotlib - Ellipse with Units
- Matplotlib - Spines
- Matplotlib - Axis Ranges
- Matplotlib - Axis Scales
- Matplotlib - Axis Ticks
- Matplotlib - Formatting Axes
- Matplotlib - Axes Class
- Matplotlib - Twin Axes
- Matplotlib - Figure Class
- Matplotlib - Multiplots
- Matplotlib - Grids
- Matplotlib - Object-oriented Interface
- Matplotlib - PyLab module
- Matplotlib - Subplots() Function
- Matplotlib - Subplot2grid() Function
- Matplotlib - Anchored Artists
- Matplotlib - Manual Contour
- Matplotlib - Coords Report
- Matplotlib - AGG filter
- Matplotlib - Ribbon Box
- Matplotlib - Fill Spiral
- Matplotlib - Findobj Method
- Matplotlib - Hyperlinks
- Matplotlib - Image Thumbnail
- Matplotlib - Plotting with Keywords
- Matplotlib - Create Logo
- Matplotlib - Multipage PDF
- Matplotlib - Multiprocessing
- Matplotlib - Print Stdout
- Matplotlib - Compound Path
- Matplotlib - Sankey Class
- Matplotlib - MRI with EEG
- Matplotlib - Stylesheets
- Matplotlib - Background Colors
- Matplotlib - Basemap
Matplotlib Events
- Matplotlib - Event Handling
- Matplotlib - Close Event
- Matplotlib - Mouse Move
- Matplotlib - Click Events
- Matplotlib - Scroll Event
- Matplotlib - Keypress Event
- Matplotlib - Pick Event
- Matplotlib - Looking Glass
- Matplotlib - Path Editor
- Matplotlib - Poly Editor
- Matplotlib - Timers
- Matplotlib - Viewlims
- Matplotlib - Zoom Window
Matplotlib Widgets
- Matplotlib - Cursor Widget
- Matplotlib - Annotated Cursor
- Matplotlib - Button Widget
- Matplotlib - Check Buttons
- Matplotlib - Lasso Selector
- Matplotlib - Menu Widget
- Matplotlib - Mouse Cursor
- Matplotlib - Multicursor
- Matplotlib - Polygon Selector
- Matplotlib - Radio Buttons
- Matplotlib - RangeSlider
- Matplotlib - Rectangle Selector
- Matplotlib - Ellipse Selector
- Matplotlib - Slider Widget
- Matplotlib - Span Selector
- Matplotlib - Textbox
Matplotlib Plotting
- Matplotlib - Line Plots
- Matplotlib - Area Plots
- Matplotlib - Bar Graphs
- Matplotlib - Histogram
- Matplotlib - Pie Chart
- Matplotlib - Scatter Plot
- Matplotlib - Box Plot
- Matplotlib - Arrow Demo
- Matplotlib - Fancy Boxes
- Matplotlib - Zorder Demo
- Matplotlib - Hatch Demo
- Matplotlib - Mmh Donuts
- Matplotlib - Ellipse Demo
- Matplotlib - Bezier Curve
- Matplotlib - Bubble Plots
- Matplotlib - Stacked Plots
- Matplotlib - Table Charts
- Matplotlib - Polar Charts
- Matplotlib - Hexagonal bin Plots
- Matplotlib - Violin Plot
- Matplotlib - Event Plot
- Matplotlib - Heatmap
- Matplotlib - Stairs Plots
- Matplotlib - Errorbar
- Matplotlib - Hinton Diagram
- Matplotlib - Contour Plot
- Matplotlib - Wireframe Plots
- Matplotlib - Surface Plots
- Matplotlib - Triangulations
- Matplotlib - Stream plot
- Matplotlib - Ishikawa Diagram
- Matplotlib - 3D Plotting
- Matplotlib - 3D Lines
- Matplotlib - 3D Scatter Plots
- Matplotlib - 3D Contour Plot
- Matplotlib - 3D Bar Plots
- Matplotlib - 3D Wireframe Plot
- Matplotlib - 3D Surface Plot
- Matplotlib - 3D Vignettes
- Matplotlib - 3D Volumes
- Matplotlib - 3D Voxels
- Matplotlib - Time Plots and Signals
- Matplotlib - Filled Plots
- Matplotlib - Step Plots
- Matplotlib - XKCD Style
- Matplotlib - Quiver Plot
- Matplotlib - Stem Plots
- Matplotlib - Visualizing Vectors
- Matplotlib - Audio Visualization
- Matplotlib - Audio Processing
Matplotlib Useful Resources
- Matplotlib - Quick Guide
- Matplotlib - Cheatsheet
- Matplotlib - Useful Resources
- Matplotlib - Discussion
Matplotlib - Click Events
In general, a click event occurs when a user interacts with a computer interface by pressing and releasing a mouse button or tapping on a touchscreen device. This event serves as a trigger for the computer system to recognize and respond to the user's input.
In the context of data visualization, like in Matplotlib or other plotting libraries, a click event can be used to capture specific user interactions with the plot, offering a dynamic and interactive experience. This could include tasks such as selecting data points, triggering updates or enabling user-initiated actions.
Click Events in Matplotlib
In Matplotlib, a click event occurs when a user interacts with a plot by clicking on the figure or a specific region within it. These events are associated with callback functions that are executed when the click happens. This can be done by connecting a callback function to the button_press_event using the mpl_connect() method on the figure canvas.
Let's see a basic example that demonstrates how a simple click event works.
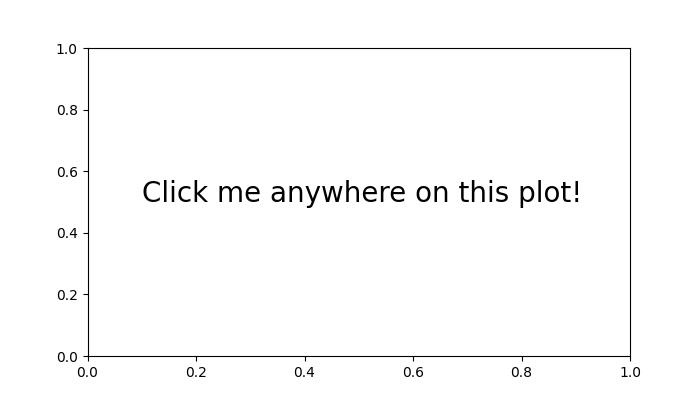
Example - Handling a Single Click Event
In this example, a click event is handled by the onclick function, which prints a message to the console when the user clicks anywhere on the plot. The figure contains a text element prompting the user to click.
import numpy as np
import matplotlib.pyplot as plt

def onclick(event):
   print('The Click Event Triggered!')

fig, ax = plt.subplots(figsize=(7, 4))
ax.text(0.1, 0.5, 'Click me anywhere on this plot!', dict(size=20))
cid = fig.canvas.mpl_connect('button_press_event', onclick)
plt.show()
Output
On executing the above code we will get the following output −
The Click Event Triggered!
The Click Event Triggered!
The Click Event Triggered!
The Click Event Triggered!
The Click Event Triggered!
The Click Event Triggered!
Watch the video below to observe how the click event feature works here.
Storing Click Event Coordinates
Storing click event coordinates allows you to gather information about user interactions on a plot, facilitating tasks such as data point selection or analysis.
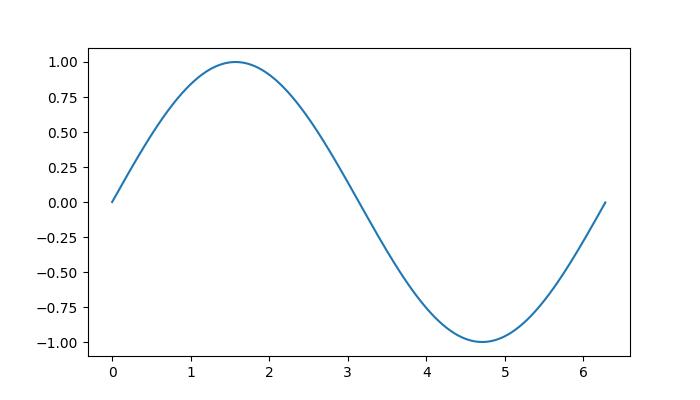
Example - Printing Mouse Coordinates on Click Event
Here is an example that stores and prints the coordinates of mouse clicks on the plot. This demonstrates how click events can be used to gather information about user interactions on a plot.
import numpy as np
import matplotlib.pyplot as plt

x = np.arange(0, 2*np.pi, 0.01)
y = np.sin(x)

fig = plt.figure()
ax = fig.add_subplot(111)
ax.plot(x, y)

clicked_coords = []

def onclick(event):
   global ix, iy
   ix, iy = event.xdata, event.ydata
   print(f'Clicked at x = {ix}, y = {iy}')

   global clicked_coords
   clicked_coords.append((ix, iy))

   # Disconnect the click event after collecting 5 coordinates
   if len(clicked_coords) == 5:
      fig.canvas.mpl_disconnect(cid)
      print('Reached the maximum clicks...')

cid = fig.canvas.mpl_connect('button_press_event', onclick)
plt.show()
Output
On executing the above code we will get the following output −
Clicked at x = 0.0743760368663593, y = 0.11428680137603275
Clicked at x = 1.4368755760368663, y = 0.9928568371128363
Clicked at x = 3.130449769585254, y = 0.10714395555703438
Clicked at x = 4.7221548387096774, y = -1.014282838025715
Clicked at x = 6.377528110599078, y = 0.04285834318604875
Reached the maximum clicks...
Watch the video below to observe how the click event feature works here.
Click Event with Checkbox
Integrating the checkbox widget with click events offers a dynamic way to control user interactions on the plots. By combining checkboxes with click events, you can enable or disable certain features, providing users with interactive control over the plot.
Example - Handling Checkbox Click Event
In this example, a checkbox is used to control the adding text on the plot where the click event is triggered.
import matplotlib.pyplot as plt
from matplotlib.widgets import CheckButtons
import numpy as np

def onclick(event):
   # Only use events within the axes.
   if not event.inaxes == ax1:
      return

   # Check if Checkbox is "on"
   if check_box.get_status()[0]:
      ix, iy = event.xdata, event.ydata
      coords3.append((ix, iy))

      # write text with coordinats where clicks occur
      if len(coords3) >= 1:
         ax1.annotate(f"* {ix:.1f}, {iy:.1f}", xy=(ix, iy), color="green")
         fig.canvas.draw_idle()

      # Disconnect after 6 clicks
      if len(coords3) >= 6:
         fig.canvas.mpl_disconnect(cid)
         print('Reached the maximum clicks...')
         plt.close(fig)

x = np.arange(0, 2*np.pi, 0.01)
y = np.sin(2*x)

fig, ax1 = plt.subplots(figsize=(7, 4))
ax1.plot(x, y)
ax1.set_title('This is my plot')

ax2 = plt.axes([0.7, 0.05, 0.1, 0.075])
check_box = CheckButtons(ax2, ['On',], [False,], check_props={'color':'red', 'linewidth':1})

coords3 = []
cid = fig.canvas.mpl_connect('button_press_event', onclick)
plt.show()
Output
On executing the above code we will get the following output −
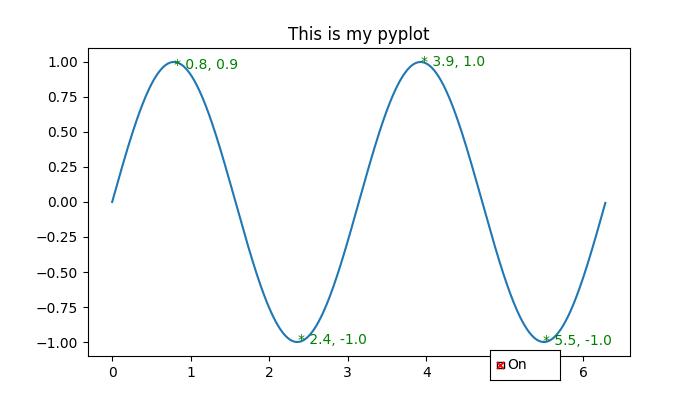
Reached the maximum clicks...
Watch the video below to observe how the click event feature works here.