- Matplotlib - Home
- Matplotlib - Introduction
- Matplotlib - Vs Seaborn
- Matplotlib - Environment Setup
- Matplotlib - Anaconda distribution
- Matplotlib - Jupyter Notebook
- Matplotlib - Pyplot API
- Matplotlib - Simple Plot
- Matplotlib - Saving Figures
- Matplotlib - Markers
- Matplotlib - Figures
- Matplotlib - Styles
- Matplotlib - Legends
- Matplotlib - Colors
- Matplotlib - Colormaps
- Matplotlib - Colormap Normalization
- Matplotlib - Choosing Colormaps
- Matplotlib - Colorbars
- Matplotlib - Working With Text
- Matplotlib - Text properties
- Matplotlib - Subplot Titles
- Matplotlib - Images
- Matplotlib - Image Masking
- Matplotlib - Annotations
- Matplotlib - Arrows
- Matplotlib - Fonts
- Matplotlib - Font Indexing
- Matplotlib - Font Properties
- Matplotlib - Scales
- Matplotlib - LaTeX
- Matplotlib - LaTeX Text Formatting in Annotations
- Matplotlib - PostScript
- Matplotlib - Mathematical Expressions
- Matplotlib - Animations
- Matplotlib - Celluloid Library
- Matplotlib - Blitting
- Matplotlib - Toolkits
- Matplotlib - Artists
- Matplotlib - Styling with Cycler
- Matplotlib - Paths
- Matplotlib - Path Effects
- Matplotlib - Transforms
- Matplotlib - Ticks and Tick Labels
- Matplotlib - Radian Ticks
- Matplotlib - Dateticks
- Matplotlib - Tick Formatters
- Matplotlib - Tick Locators
- Matplotlib - Basic Units
- Matplotlib - Autoscaling
- Matplotlib - Reverse Axes
- Matplotlib - Logarithmic Axes
- Matplotlib - Symlog
- Matplotlib - Unit Handling
- Matplotlib - Ellipse with Units
- Matplotlib - Spines
- Matplotlib - Axis Ranges
- Matplotlib - Axis Scales
- Matplotlib - Axis Ticks
- Matplotlib - Formatting Axes
- Matplotlib - Axes Class
- Matplotlib - Twin Axes
- Matplotlib - Figure Class
- Matplotlib - Multiplots
- Matplotlib - Grids
- Matplotlib - Object-oriented Interface
- Matplotlib - PyLab module
- Matplotlib - Subplots() Function
- Matplotlib - Subplot2grid() Function
- Matplotlib - Anchored Artists
- Matplotlib - Manual Contour
- Matplotlib - Coords Report
- Matplotlib - AGG filter
- Matplotlib - Ribbon Box
- Matplotlib - Fill Spiral
- Matplotlib - Findobj Method
- Matplotlib - Hyperlinks
- Matplotlib - Image Thumbnail
- Matplotlib - Plotting with Keywords
- Matplotlib - Create Logo
- Matplotlib - Multipage PDF
- Matplotlib - Multiprocessing
- Matplotlib - Print Stdout
- Matplotlib - Compound Path
- Matplotlib - Sankey Class
- Matplotlib - MRI with EEG
- Matplotlib - Stylesheets
- Matplotlib - Background Colors
- Matplotlib - Basemap
Matplotlib Events
- Matplotlib - Event Handling
- Matplotlib - Close Event
- Matplotlib - Mouse Move
- Matplotlib - Click Events
- Matplotlib - Scroll Event
- Matplotlib - Keypress Event
- Matplotlib - Pick Event
- Matplotlib - Looking Glass
- Matplotlib - Path Editor
- Matplotlib - Poly Editor
- Matplotlib - Timers
- Matplotlib - Viewlims
- Matplotlib - Zoom Window
Matplotlib Widgets
- Matplotlib - Cursor Widget
- Matplotlib - Annotated Cursor
- Matplotlib - Button Widget
- Matplotlib - Check Buttons
- Matplotlib - Lasso Selector
- Matplotlib - Menu Widget
- Matplotlib - Mouse Cursor
- Matplotlib - Multicursor
- Matplotlib - Polygon Selector
- Matplotlib - Radio Buttons
- Matplotlib - RangeSlider
- Matplotlib - Rectangle Selector
- Matplotlib - Ellipse Selector
- Matplotlib - Slider Widget
- Matplotlib - Span Selector
- Matplotlib - Textbox
Matplotlib Plotting
- Matplotlib - Line Plots
- Matplotlib - Area Plots
- Matplotlib - Bar Graphs
- Matplotlib - Histogram
- Matplotlib - Pie Chart
- Matplotlib - Scatter Plot
- Matplotlib - Box Plot
- Matplotlib - Arrow Demo
- Matplotlib - Fancy Boxes
- Matplotlib - Zorder Demo
- Matplotlib - Hatch Demo
- Matplotlib - Mmh Donuts
- Matplotlib - Ellipse Demo
- Matplotlib - Bezier Curve
- Matplotlib - Bubble Plots
- Matplotlib - Stacked Plots
- Matplotlib - Table Charts
- Matplotlib - Polar Charts
- Matplotlib - Hexagonal bin Plots
- Matplotlib - Violin Plot
- Matplotlib - Event Plot
- Matplotlib - Heatmap
- Matplotlib - Stairs Plots
- Matplotlib - Errorbar
- Matplotlib - Hinton Diagram
- Matplotlib - Contour Plot
- Matplotlib - Wireframe Plots
- Matplotlib - Surface Plots
- Matplotlib - Triangulations
- Matplotlib - Stream plot
- Matplotlib - Ishikawa Diagram
- Matplotlib - 3D Plotting
- Matplotlib - 3D Lines
- Matplotlib - 3D Scatter Plots
- Matplotlib - 3D Contour Plot
- Matplotlib - 3D Bar Plots
- Matplotlib - 3D Wireframe Plot
- Matplotlib - 3D Surface Plot
- Matplotlib - 3D Vignettes
- Matplotlib - 3D Volumes
- Matplotlib - 3D Voxels
- Matplotlib - Time Plots and Signals
- Matplotlib - Filled Plots
- Matplotlib - Step Plots
- Matplotlib - XKCD Style
- Matplotlib - Quiver Plot
- Matplotlib - Stem Plots
- Matplotlib - Visualizing Vectors
- Matplotlib - Audio Visualization
- Matplotlib - Audio Processing
Matplotlib Useful Resources
- Matplotlib - Quick Guide
- Matplotlib - Cheatsheet
- Matplotlib - Useful Resources
- Matplotlib - Discussion
Matplotlib - ErrorBar
An error bar is a graphical representation that shows the amount of uncertainty or variation in a set of data. It consists of line(s) that extend from a data point on a graph to indicate the range within which the true value is probably located.
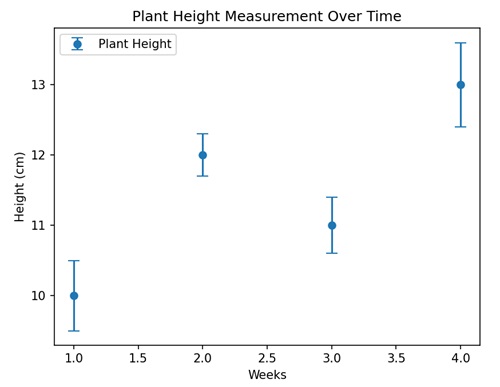
Imagine you are measuring the height of a plant every week for a month. Each time you measure, there might be a little bit of variation due to factors like changes in weather. The error bar on your graph will show this range of possible values for each height measurement, giving you an idea of how confident you can be in the accuracy of your data −
Errorbar in Matplotlib
We can create an errorbar in Matplotlib using the errorbar() function. It allows you to represent uncertainty in both the x and y directions, making it useful to depict error bars in various types of plots, such as scatter plots, line plots, or bar plots.
The errorbar() Function
The errorbar() function in Matplotlib takes x and y coordinates, indicating the uncertainty in data points. This function is particularly useful for visualizing the range of possible values around each data point, providing a better understanding of how certain or uncertain the measurements are.
Syntax
Following is the syntax of the errorbar() function in Matplotlib −
matplotlib.pyplot.errorbar(x, y, yerr=None, xerr=None, fmt='', barsabove=False, lolims=False, uplims=False, xlolims=False, xuplims=False, errorevery=1, capthick=None, *, data=None, **kwargs)
Where,
- x is the x-coordinates of the data points.
- y is the y-coordinates of the data points.
- yerr is the error in the y-direction. It can be a scalar or an array.
- xerr is the error in the x-direction. It can be a scalar or an array.
- fmt is the format code controlling the appearance of lines and markers.
- If barsabove is True, error bars are drawn above data points.
- lolims, uplims, xlolims, xuplims are the Booleans indicating whether the errors represent lower/upper limits or if x-limits are specified.
- errorevery subsample the error bars by an integer factor.
- capthick is the thickness of the caps on the error bars.
Example - Basic Errorbar Plot
A basic errorbar plot in Matplotlib is a visual representation of data points along with their associated uncertainties (errors). It is formed using the errorbar() function, which adds vertical or horizontal error bars to each data point.
In the following example, we are creating a simple error bar plot. We define 'x' and 'y' data points along with corresponding 'y-error' values. We then use the errorbar() function to plot the data with error bars −
import matplotlib.pyplot as plt

# Data
x = [1, 2, 3, 4, 5]
y = [2, 4, 3, 5, 6]
y_error = [0.5, 0.3, 0.4, 0.2, 0.6]

# Creating a basic errorbar plot
plt.errorbar(x, y, yerr=y_error, fmt='o', label='Data with Errorbars')

# Customizing the plot
plt.xlabel('X-axis')
plt.ylabel('Y-axis')
plt.title('Basic Errorbar Plot')
plt.legend()

# Displaying the plot
plt.show()
Output
After executing the above code, we get the following output −

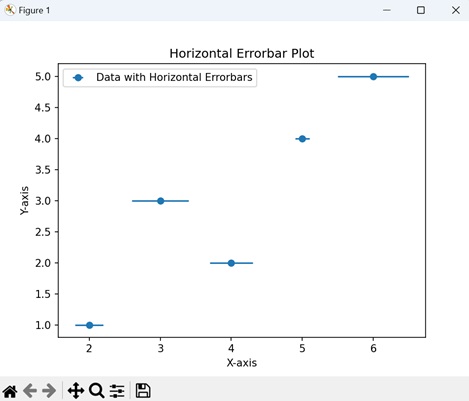
Example - Horizontal Errorbars
A horizontal errorbars plot in Matplotlib is a visual representation of data points with associated uncertainties in the horizontal direction. It is created using the errorbar() function, where error bars are drawn horizontally to show the variability or intervals in the x-direction.
In here, we are creating a plot with horizontal error bars. We first define y and x data points along with corresponding x-error values. We then use the errorbar() function to create the plot with horizontal error bars −
import matplotlib.pyplot as plt

# Data
y = [1, 2, 3, 4, 5]
x = [2, 4, 3, 5, 6]
x_error = [0.2, 0.3, 0.4, 0.1, 0.5]

# Creating horizontal errorbars
plt.errorbar(x, y, xerr=x_error, fmt='o', label='Data with Horizontal Errorbars')

# Customizing the plot
plt.xlabel('X-axis')
plt.ylabel('Y-axis')
plt.title('Horizontal Errorbar Plot')
plt.legend()

# Displaying the plot
plt.show()
Output
Following is the output of the above code −
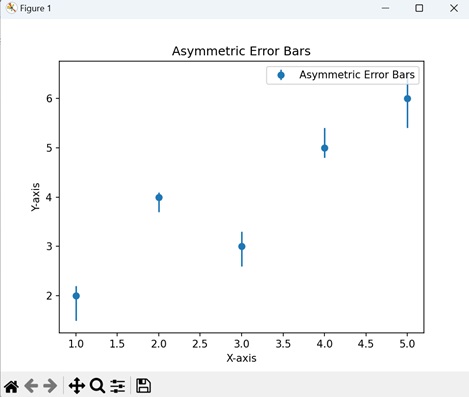
Error - Asymmetric Error Bars
In Matplotlib, asymmetric error bars allow you to represent varying levels of uncertainty or variation in both the positive and negative directions around each data point. This is useful when the errors in your measurements are not symmetrical.
You can customize the errorbar() function to handle asymmetric error bars by providing a list of two arrays to the "yerr" or "xerr" parameter, where the first array corresponds to the negative errors, and the second array corresponds to the positive errors.
Now, we are creating asymmetric error bars. The "yerr" parameter takes a list of two arrays, representing negative and positive errors separately. This allows for different error magnitudes in each direction −
import matplotlib.pyplot as plt

x = [1, 2, 3, 4, 5]
y = [2, 4, 3, 5, 6]
y_error_neg = [0.5, 0.3, 0.4, 0.2, 0.6]
y_error_pos = [0.2, 0.1, 0.3, 0.4, 0.5]

plt.errorbar(x, y, yerr=[y_error_neg, y_error_pos], fmt='o', label='Asymmetric Error Bars')
plt.xlabel('X-axis')
plt.ylabel('Y-axis')
plt.title('Asymmetric Error Bars')
plt.legend()
plt.show()
Output
Output of the above code is as follows −
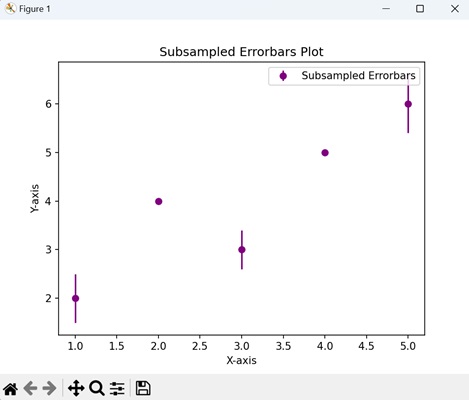
Example - Subsampled Errorbars
Subsampled error bars in Matplotlib is like selectively displaying only a subset of the error bars to improve the clarity and reduce visual noise in the plot. The errorbar() function provides the "errorevery" parameter for this purpose.
By setting "errorevery" to an integer value greater than 1, you can subsample the error bars to only show every Nth error bar, where N is the value of errorevery.
In the given example, we are generating a scatter plot with error bars. We define x and y data points, along with "y_error" values for error bars. The error bars are plotted using a purple 'o' marker and are displayed every 2 data points, thus reducing noise −
import matplotlib.pyplot as plt

# Data
x = [1, 2, 3, 4, 5]
y = [2, 4, 3, 5, 6]
y_error = [0.5, 0.3, 0.4, 0.2, 0.6]

# Creating errorbars with subsampling
plt.errorbar(x, y, yerr=y_error, fmt='o', color='purple', errorevery=2, label='Subsampled Errorbars')

# Customizing the plot
plt.xlabel('X-axis')
plt.ylabel('Y-axis')
plt.title('Subsampled Errorbars Plot')
plt.legend()

# Displaying the plot
plt.show()
Output
The output obtained is as shown below −