
Article Categories
- All Categories
-
 Data Structure
-
 Networking
-
 RDBMS
RDBMS
-
 Operating System
-
 Java
Java
-
 MS Excel
-
 iOS
iOS
-
 HTML
HTML
-
 CSS
CSS
-
 Android
-
 Python
-
 C Programming
-
 C++
C++
-
 C#
C#
-
 MongoDB
-
 MySQL
MySQL
-
 Javascript
-
 PHP
PHP
-
 Economics & Finance
Selected Reading
How to give a Pandas/Matplotlib bar graph custom colors?
To make a custom color, we can create a hexadecimal string. From it, we can make different sets of color representation and can pass them into the scatter method to get the desired output.
Using the set_color method, we could set the color of the bar.
Steps
Take user input for the number of bars.
Add bar using plt.bar() method.
Create colors from hexadecimal alphabets by choosing random characters.
Set the color for every bar, using set_color() method.
To show the figure we can use plt.show() method.
Example
from matplotlib import pyplot as plt
import random

bar_count = int(input("Enter number of bars: "))

bars = plt.bar([i for i in range(1, bar_count+1)], [i for i in range(1, bar_count+1)])

hexadecimal_alphabets = '0123456789ABCDEF'
colors = ["#" + ''.join([random.choice(hexadecimal_alphabets) for j in
range(6)]) for i in range(bar_count)]

for i in range(len(colors)):
   bars[i].set_color(colors[i])

plt.show()
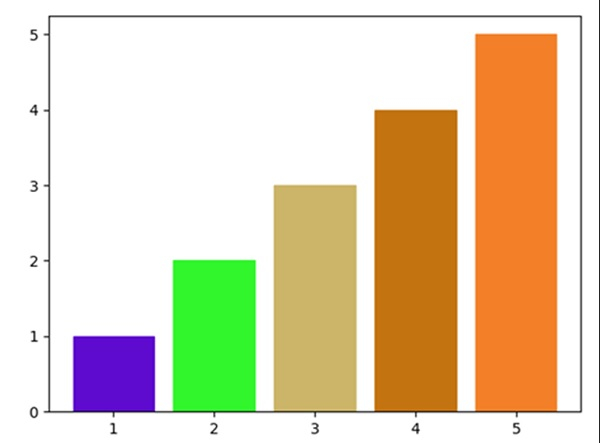
Output
Enter number of bars: 5

Updated on: 2021-03-16T10:19:16+05:30
4K+ Views

Advertisements