
 Data Structure
 Networking
 RDBMS
RDBMS Operating System
 Java
Java MS Excel
 iOS
iOS HTML
HTML CSS
CSS Android
 Python
 C Programming
 C++
C++ C#
C# MongoDB
 MySQL
MySQL Javascript
 PHP
PHP
- Selected Reading
- UPSC IAS Exams Notes
- Developer's Best Practices
- Questions and Answers
- Effective Resume Writing
- HR Interview Questions
- Computer Glossary
- Who is Who
Remove NaN values from a dataframe without fillna or Interpolate (Python Matplotlib)
To remove NaN values from a dataframe without filter or interpolate, we can take the following steps −
Steps
Set the figure size and adjust the padding between and around the subplots.
Create an array to make a Pandas data frame.
One-dimensional ndarray with axis labels (including time series).
Plotting interpolation, 'index', 'values' − Use the actual numerical values of the index.
To display the figure, use show() method.
Example
import numpy as np
import pandas as pd
from matplotlib import pyplot as plt

# Set the figure size
plt.rcParams["figure.figsize"] = [7.50, 3.50]
plt.rcParams["figure.autolayout"] = True

# Numpy array
data = np.array([1., 1.2, 0.89, np.NAN,
   1.2, np.NAN, 1.89, 2.09,
   .78, .67, np.NAN, 1.78,
   np.NAN, 1.56, 1.89, 2.78]
   )

# Pandas dataframe
df = pd.Series(data)

# Plot the interpolation
df.interpolate('index').plot(marker='o')

# Display the plot
plt.show()
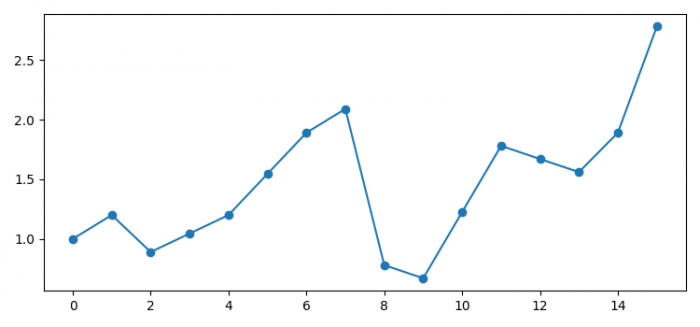
Output
It will produce the following output −

Updated on: 2022-02-01T11:47:54+05:30
2K+ Views

Advertisements