- Polymer - Home
- Polymer - Overview
- Polymer - Installation
- Polymer - Elements
- Polymer - Custom Elements
- Polymer - Shadow DOM and Styling
- Polymer - Events
- Polymer - Data System
Polymer - Google Chart
The <google-chart> is an element containing charts used for visualizing the data. This element contains various charts such as pie chart, line chart, column chart, area chart, tree map, etc.
Note − For a valid JSON, you must use single quotes if you are passing JSON as attributes.
You can specify height and width as style attributes as shown below −
google-chart {
   height: 100px;
   width: 300px;
}
You can provide the data using any one of the following ways −
- Using cols and rows attribute.
cols = '[{"label":"Month", "type":"string"}, {"label":"Days", "type":"number"}]'
rows = '[["Oct", 31],["Nov", 30],["Dec", 31]]'
- Using data attribute, you can pass in the data directly.
data = '[["Month", "Days"], ["Oct", 31], ["Nov", 30], ["Dec", 31]]'
- Using data attribute, you can pass data in the URL.
data = 'http://demo.com/chart-data.json'
- Using data attribute, you can pass data in a Google DataTable object
data = '{{dataTable}}'
- Using view attribute
view = '{{dataView}}'
You can set the lang attribute on the html tag, if you want to display the charts in locales other than "en" as shown in the following code snippet.
<html lang = "ja">
Example
To use the google-chart element, navigate to your project folder in the command prompt and use the following command.
bower install PolymerElements/google-chart --save
The above command installs the google-chart element in bower_components folder. Next, import the google-chart file in your index.html using the following command.
<link rel = "import" href = "/bower_components/google-chart/google-chart.html">
The following example demonstrates the use of google-chart element.
<!DOCTYPE html>
<html>
   <head>
      <title>google-chart</title>
      <base href = "http://polygit.org/components/">
      <script src = "webcomponentsjs/webcomponents-lite.min.js"></script>
      <link rel = "import" href = "google-chart/google-chart.html">
   </head>

   <body>
      <google-chart
         type = 'pie'
         options = '{"title": "Pie Chart", "vAxis": {"minValue" : 0, "maxValue": 8}}'
         cols = '[{"label": "Country", "type": "string"},{"label": "Value", "type": "number"}]'
         rows = '[["Germany", 5.0],["US", 4.0],["Africa", 11.0],["France", 4.0]]'>
      </google-chart>
   </body>
</html>
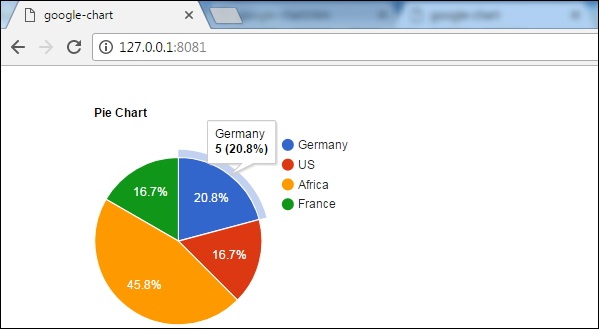
Output
To run the application, navigate to your project directory and run the following command.
polymer serve
Now open the browser and navigate to http://127.0.0.1:8081/. Following will be the output.