- Pentaho - Home
- Pentaho - Overview
- Pentaho - Installation
- Pentaho - Navigation
- Pentaho - Data Sources & Queries
- Pentaho - Reporting Elements
- Pentaho - Page Footer Fields
- Pentaho - Groups
- Pentaho - Chart Report
- Formatting Report Elements
- Pentaho - Functions
Pentaho - Groups
Pentaho offers various functionalities and features to convert raw data into meaningful information. Here, we will learn how to use one such feature Groups. You can use this feature to segregate raw row-set data into groups so that the user can easily understand the report.
Grouping is a great way to divide long lists of data along meaningful separators.
With groups, you can keep similar items together and visually separate these items from other groups of items.
You will also need groups to perform various aggregations over the data, like printing the number of items in a group or calculating sums or averages.
Adding Groups in Pentaho
We already have a report based on the employee data. Here the query is to group all employee records according to "department". Follow the procedure given below to fulfill the given requirement.
First of all, you start the process by clicking the Add group button on the Structure pane. The Add group button is marked as "1" in the following screenshot.
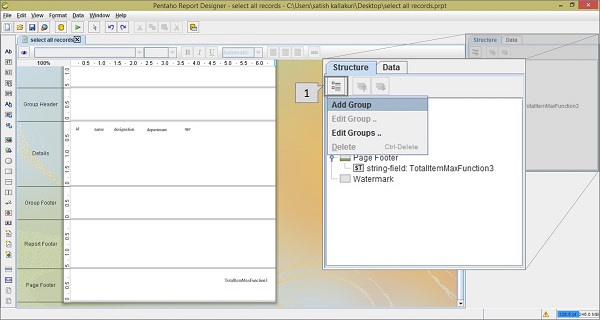
You will get a list of options by clicking the Add group button. Then, click the Add group option from the list.
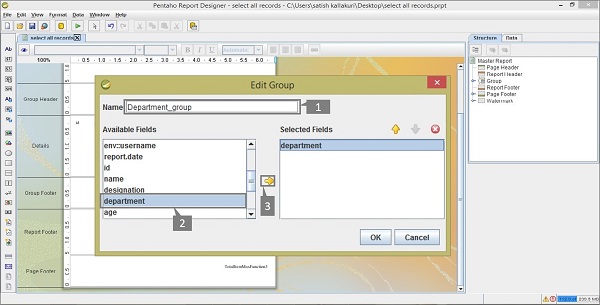
After clicking Add Group, you will find a dialogue box using which you can add a group field from the given available fields.
Take a look at the following screenshot. The three activities are highlighted in the dialog box which we have marked as 1, 2, and 3.
Pointer 1 − Enter a user-defined name for this group.
Pointer 2 − Select the department field from the available fields list.
Pointer 3 − Click the arrow (→) button so that the selected field gets copied to the selected Fields list.
Select that department field in the selected fields list and click OK to confirm.
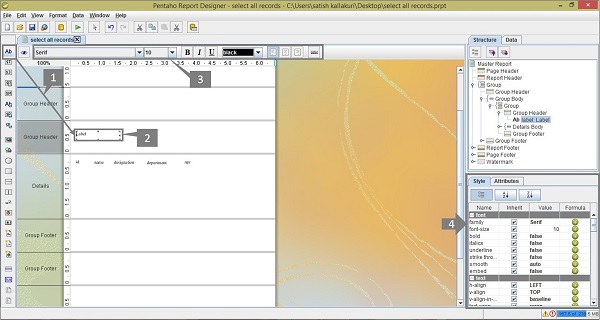
After adding the group, you will find it in the Structure tab of the Structure pane. And you will find the Group Header and Group Footer bands in the workspace.
Take a look at the following screenshot. Add a static label to your report by dragging the label icon from the palette on the left side of the Report Designer into the group header (in the screenshot, this activity has been marked as 1).
By double-clicking the label, you can edit it and change the name to Department. By using the Formatting Toolbar or the Formatting Palette (marked as "3" and "4" respectively), you can change the format of the label.
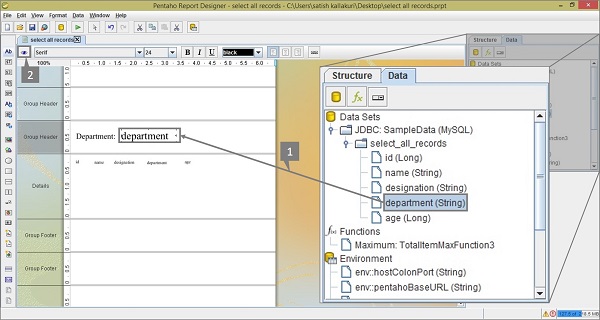
Let us now proceed further. Switch the Structure pane to Data tab. Select and drag the department field from the Structure pane to the Group Header (this activity is marked as 1 in the following screenshot). To see a preview of your report, click the preview button on the left side of the screen which is highlighted and marked as 2 in the following screenshot.
After clicking the preview button, you will find the result report as shown in the following screenshot. You will find the records have now been grouped together according to department.
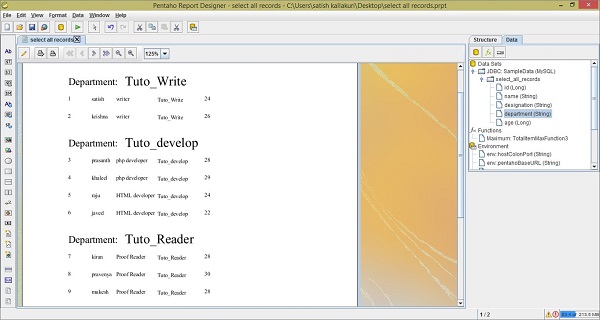
The report does not look very appealing at this stage. You can add a touch of color and make the heading more effective using the Formatting Toolbar or the Formatting Palette.
You are now ready to generate different types of reports using Pentaho. Just follow the steps discussed so far and try to use all the features and options available in Pentaho.
