 Data Structure
 Networking
 RDBMS
RDBMS Operating System
 Java
Java MS Excel
 iOS
iOS HTML
HTML CSS
CSS Android
 Python
 C Programming
 C++
C++ C#
C# MongoDB
 MySQL
MySQL Javascript
 PHP
PHP
- Selected Reading
- UPSC IAS Exams Notes
- Developer's Best Practices
- Questions and Answers
- Effective Resume Writing
- HR Interview Questions
- Computer Glossary
- Who is Who
path_curve_to_quadratic_bezier() function in Python Wand
The bezier is an inbuilt drawing function in python. It is used to draw curves in python according to given points.
The quadratic bezier is a Python function that draws a path through vertices( control points) for a quadratic bezier wind. A quadratic Bezier wind is a parametric wind that defines a path in 2- dimensional space. This wind is linked by a control point with two ending points.
In a visualisation programme, you may construct and draw easily using this function. With the use of the time parameter, you may locate two control points and determine their locations. You may construct sensitive locations in this way and link such locations like a wind. With the help of this function we can easily create curves and shapes which can be hard or impossible to create using another function or methods. For example, with the help of quadratic Bezier function we can create different-different types of graphs and animations.
Syntax
This syntax is used for given example ?
def quadratic_bezier(p0, p1, p2, t):
Here p0, p1 and p2 represent the points, and t represents the values.
Example 1
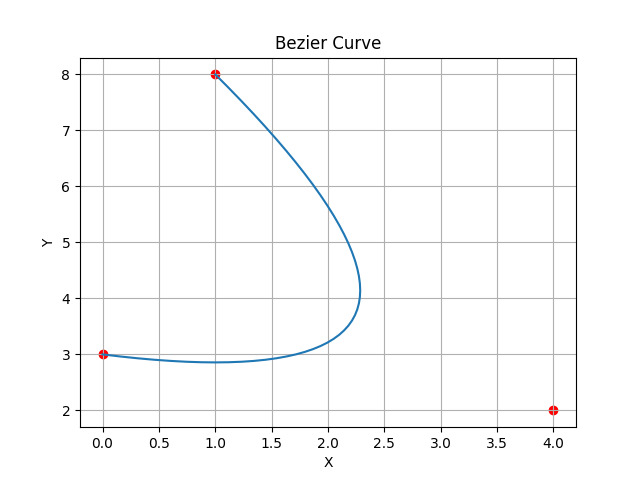
In this program we are drawing the curve using different points.
import matplotlib.pyplot as plt
import numpy as np

def quad_bez(p0, p1, p2, t):
   t1 = np.linspace(0, 1, t)
   x = (1 - t1) ** 2 * p0[0] + 2 * (1 - t1) * t1 * p1[0] + t1 ** 2 * p2[0]
   y = (1 - t1) ** 2 * p0[1] + 2 * (1 - t1) * t1 * p1[1] + t1 ** 2 * p2[1]
   return x, y

p0 = (0, 3)   # beginning  point
p1 = (4, 2)   # Control point
p2 = (1, 8)   # finishing point
t = 50

x, y = quad_bez(p0, p1, p2, t)

plt.plot(x, y)
plt.scatter([p0[0], p1[0], p2[0]], [p0[1], p1[1], p2[1]], c='red')
plt.xlabel('X')
plt.ylabel('Y')
plt.title('Bezier Curve')
plt.grid(True)
plt.show()
Output

In this code, we have created a Bezier curve using matplotlib and numpy. We have defined and used to plot the points running on a Bezier curve. The starting point, control point and ending point will be displayed in the output.
Example 2
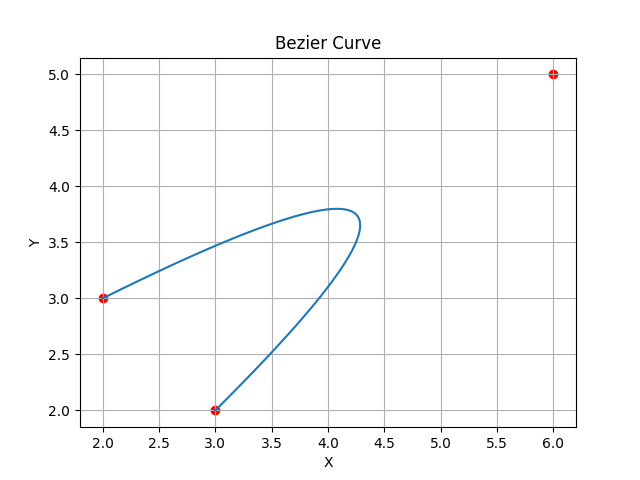
In this program we are drawing the curve using different points.
import matplotlib.pyplot as plt
import numpy as np

def quad_bez(p0, p1, p2, t):
   t1 = np.linspace(0, 1, t)
   x = (1 - t1) ** 2 * p0[0] + 2 * (1 - t1) * t1 * p1[0] + t1 ** 2 * p2[0]
   y = (1 - t1) ** 2 * p0[1] + 2 * (1 - t1) * t1 * p1[1] + t1 ** 2 * p2[1]
   return x, y

p0 = (2, 3)   # beginning  point
p1 = (6, 5)   # Control point
p2 = (3, 2)   # finishing point
t = 50

x, y = quad_bez(p0, p1, p2, t)

plt.plot(x, y)
plt.scatter([p0[0], p1[0], p2[0]], [p0[1], p1[1], p2[1]], c='red')
plt.xlabel('X')
plt.ylabel('Y')
plt.title('Bezier Curve')
plt.grid(True)
plt.show()
Output

In this code, We have used matplotlib and numpy to produce a Bezier curve. The points starting on a Bezier curve are defined and plotted using the technique we use. The output will show the starting point, control point, and finishing point.
Example 3
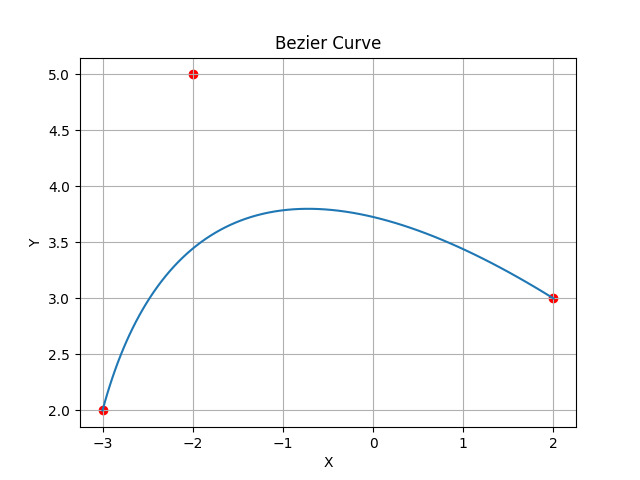
In this program we are drawing the curve using different points.
import matplotlib.pyplot as plt
import numpy as np

def quad_bez(p0, p1, p2, t):
   t1 = np.linspace(0, 1, t)
   x = (1 - t1) ** 2 * p0[0] + 2 * (1 - t1) * t1 * p1[0] + t1 ** 2 * p2[0]
   y = (1 - t1) ** 2 * p0[1] + 2 * (1 - t1) * t1 * p1[1] + t1 ** 2 * p2[1]
   return x, y

p0 = (2, 3)   # beginning  point
p1 = (-2, 5)   # Control point
p2 = (-3, 2)   # finishing point
t = 80

x, y = quad_bez(p0, p1, p2, t)

plt.plot(x, y)
plt.scatter([p0[0], p1[0], p2[0]], [p0[1], p1[1], p2[1]], c='red')
plt.xlabel('X')
plt.ylabel('Y')
plt.title('Bezier Curve')
plt.grid(True)
plt.show()
Output

In this code, To create a Bezier curve, matplotlib and numpy were used. The method we use defines and plots the points at the beginning of a Bezier curve. The beginning position, control point, and finishing point will all be displayed in the output or in the graph.
Example 4
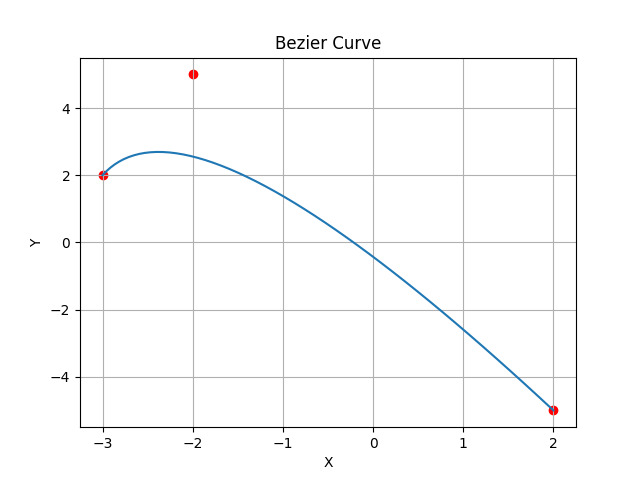
In this program we are drawing the curve using different points.
import matplotlib.pyplot as plt
import numpy as np

def quad_bez(p0, p1, p2, t):
   t1 = np.linspace(0, 1, t)
   x = (1 - t1) ** 2 * p0[0] + 2 * (1 - t1) * t1 * p1[0] + t1 ** 2 * p2[0]
   y = (1 - t1) ** 2 * p0[1] + 2 * (1 - t1) * t1 * p1[1] + t1 ** 2 * p2[1]
   return x, y

p0 = (2, -5)   # beginning  point
p1 = (-2, 5)   # Control point
p2 = (-3, 2)   # finishing point
t = 50

x, y = quad_bez(p0, p1, p2, t)

plt.plot(x, y)
plt.scatter([p0[0], p1[0], p2[0]], [p0[1], p1[1], p2[1]], c='red')
plt.xlabel('X')
plt.ylabel('Y')
plt.title('Bezier Curve')
plt.grid(True)
plt.show()
Output

In this code, using matplotlib and numpy, we have constructed a Bezier curve. We have identified and utilised the points that go along a Bezier curve. The image will show the beginning point, control point, and finishing point.
In the above example we can see different ?different graphs created by the use of starting points, control points and ending points.
Conclusion
In conclusion, the quadratic bezier function is used in Python Wand to create smooth curves. It requires three points as input and generates a curve that passes through the endpoints and is affected by the location of the control point.

