- Nagios - Home
- Nagios - Overview
- Nagios - Architecture
- Nagios - Products
- Nagios - Installation
- Nagios - Configuration
- Nagios - Features
- Nagios - Applications
- Nagios - Hosts and Services
- Nagios - Commands
- Nagios - Checks and States
- Nagios - Ports and Protocols
- Nagios - Add-ons/Plugins
- Nagios - NRPE
- Nagios - V Shell
- Nagios - Case Study
- Nagios Useful Resources
- Nagios - Quick Guide
- Nagios - Useful Resources
- Nagios - Discussion
Nagios - NRPE
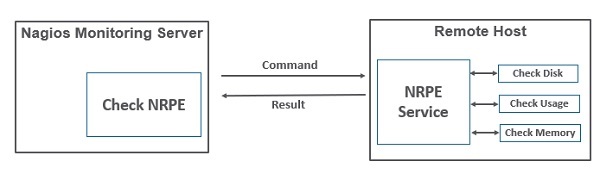
The Nagios daemon which run checks on remote machines in NRPE (Nagios Remote Plugin Executor). It allows you to run Nagios plugins on other machines remotely. You can monitor remote machine metrics such as disk usage, CPU load etc. It can also check metrics of remote windows machines through some windows agent addons.
Let us see how to install and configure NRPE step by step on client machine which needs to be monitored.
Step 1 − Run below command to install NRPE on the remote linux machine to be monitored.
sudo apt-get install nagios-nrpe-server nagios-plugins
Step 2 − Now, create a host file inside the server directory, and put all the necessary definitions for the host.
sudo gedit /usr/local/nagios/etc/servers/ubuntu_host.cfg
# Ubuntu Host configuration file

define host {
   use linux-server
   host_name ubuntu_host
   alias Ubuntu Host
   address 192.168.1.10
   register 1
}

define service {
   host_name ubuntu_host
   service_description PING
   check_command check_ping!100.0,20%!500.0,60%
   max_check_attempts 2
   check_interval 2
   retry_interval 2
   check_period 24x7
   check_freshness 1
   contact_groups admins
   notification_interval 2
   notification_period 24x7
   notifications_enabled 1
   register 1
}

define service {
   host_name ubuntu_host
   service_description Check Users
   check_command check_local_users!20!50
   max_check_attempts 2
   check_interval 2
   retry_interval 2
   check_period 24x7
   check_freshness 1
   contact_groups admins
   notification_interval 2
   notification_period 24x7
   notifications_enabled 1
   register 1
}

define service {
   host_name ubuntu_host
   service_description Local Disk
   check_command check_local_disk!20%!10%!/
   max_check_attempts 2
   check_interval 2
   retry_interval 2
   check_period 24x7
   check_freshness 1
   groups admins
   notification_interval 2
   notification_period 24x7
   notifications_enabled 1
   register 1
}

define service {
   host_name ubuntu_host
   service_description Check SSH
   check_command check_ssh
   max_check_attempts 2
   check_interval 2
   retry_interval 2
   check_period 24x7
   check_freshness 1
   contact_groups admins
   notification_interval 2
   notification_period 24x7
   notifications_enabled 1
   register 1
}

define service {
   host_name ubuntu_host
   service_description Total Process
   check_command check_local_procs!250!400!RSZDT
   max_check_attempts 2
   check_interval 2
   retry_interval 2
   check_period 24x7
   check_freshness 1
   contact_groups admins
   notification_interval 2
   notification_period 24x7
   notifications_enabled 1
   register 1
}
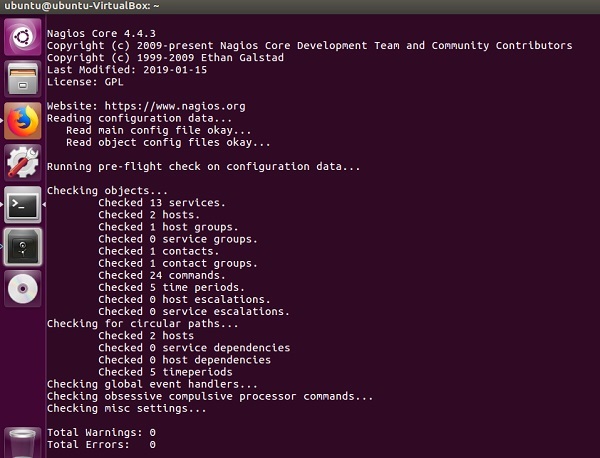
Step 3 − Run the command shown below for the verification of configuration file.
sudo /usr/local/nagios/bin/nagios -v /usr/local/nagios/etc/nagios.cfg
Step 4 − Restart NRPE, Apache and Nagios if there are no errors.
service nagios-nrpe-server restart
service apache2 restart
service nagios restart
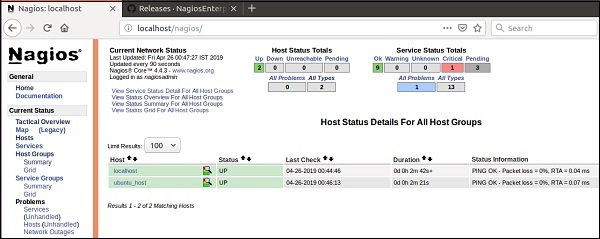
Step 5 − Open your browser and go to Nagios web interface. You can see the host which needs to be monitored has been added to Nagios core service. Similarly, you can add more hosts to be monitored by Nagios.